Today’s CometWatch entry is a single frame NAVCAM image obtained on 28 February from a distance of 102.6 km from the centre of Comet 67P/Churyumov-Gerasimenko. The image has a resolution of 8.7 m/pixel and measures 9.0 km across.
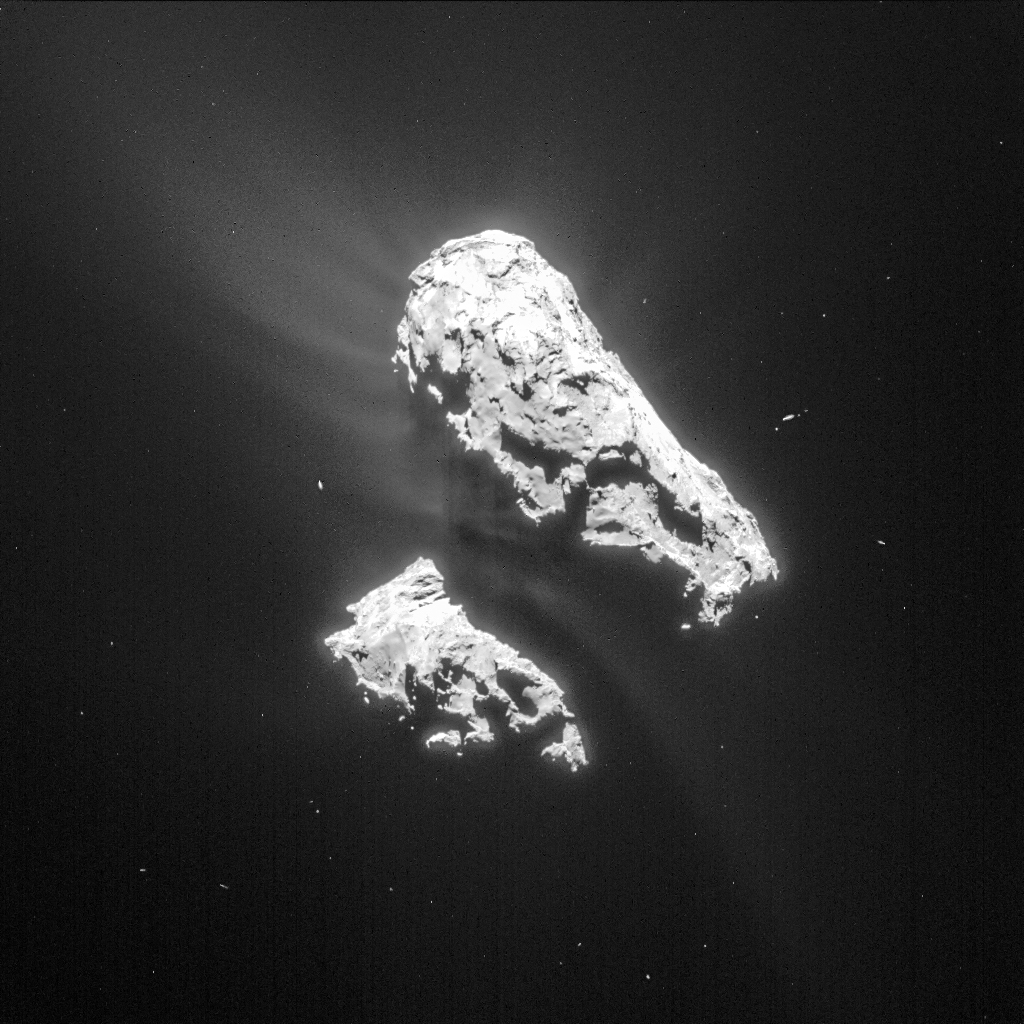
Single frame NAVCAM image of Comet 67P/C-G taken on 28 February from a distance of 102.6 km to the comet centre. The image has been processed to bring out the details of the comet’s activity. The exposure time of the image is 2.6 seconds. Credits: ESA/Rosetta/NAVCAM – CC BY-SA IGO 3.0
The view shows the large lobe of the comet to the upper right, with the small lobe to the lower left and the regions adjacent to the comet’s neck cast in shadow. This complements the images published earlier this week as CometWatch 26 February and 25-26-27 February, providing yet another perspective on the comet’s activity.
Like the four NAVCAM images posted last Wednesday, this image was also taken in support of the observations of the Alice spectrograph. For similar reasons, parts of the image depicting the nucleus are saturated, so we decided again to process the image with a focus on the activity, bringing out the elaborate geometry of the jets of dust emanating from the surface of the nucleus.
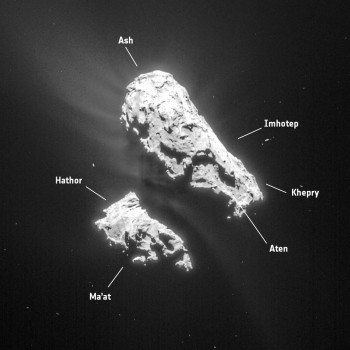
Cropped and annotated version of CometWatch 28 February. Credits: ESA/Rosetta/NAVCAM – CC BY-SA IGO 3.0
The curved shape of the outflowing material likely results from a combination of several factors, including the rotation of the comet, differential flows of near-surface gas, and gravitational effects arising due to the uneven shape of the comet. The viewing perspective of the image might also distort the true shape of the outflowing material.
We have also prepared an annotated view of today’s CometWatch to help you locate some of the regions shown in the image. You can also find regional maps of Comet 67P/C-G here and here.
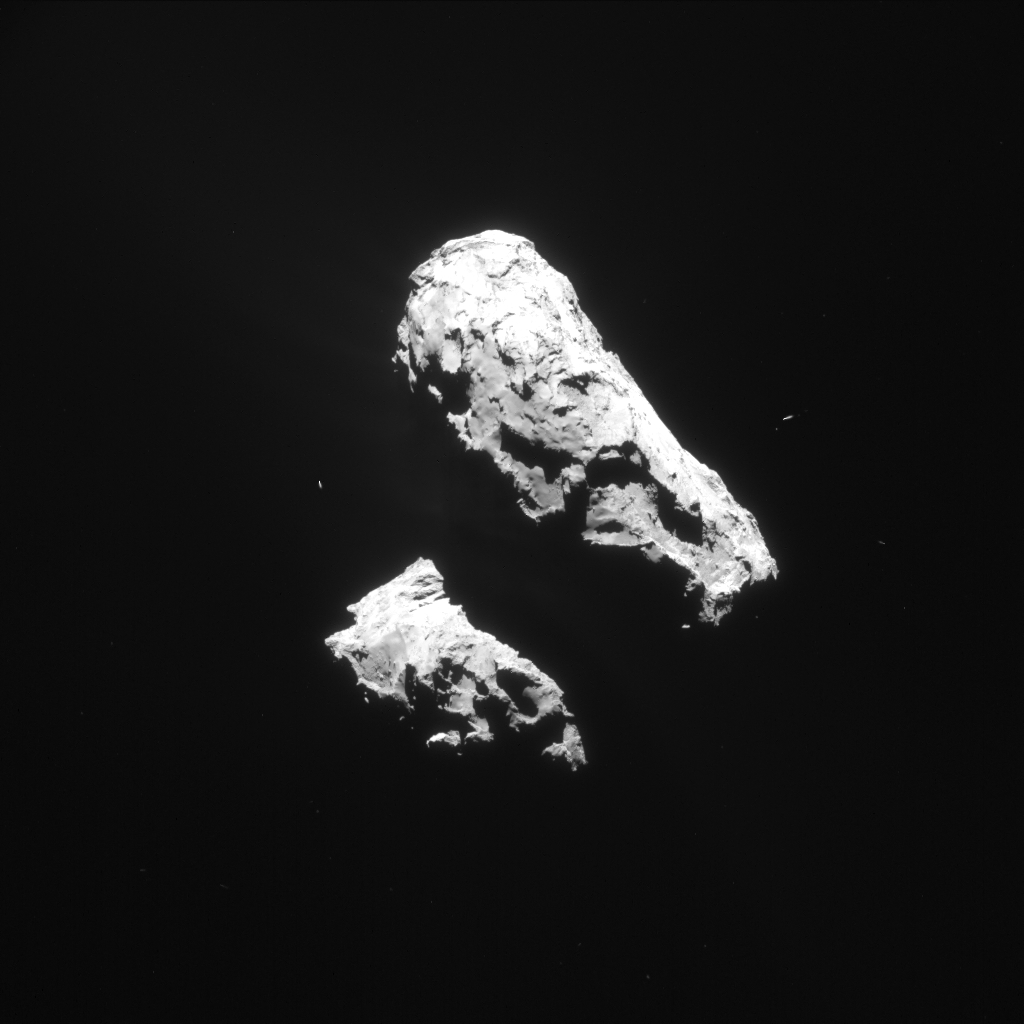
The original image is provided below:



Discussion: 63 comments
The curved shape of the outflowing material likely results from a combination of several factors : could possibly electric fields resulting of solar wind interacting with comet vapours be involved ?
Don’t mention the E word!
I would guess, that it is likely the rotation of the comet. Like emptying a bottle of water whilst your body rotates. Or our galaxy, a look from above, makes it a big swirly thing.
Main Jet at Base of Neck behaving sort of according to aerodynamics. Energy source is another issue.
Find your new annotated version ‘humanizing’ to the blog. Also very grateful of the entries made articles [, know you’re responsible for all Out-reach]. Being absurdly wishing could ask for two little moons at bottom showing solar and magnetic angles.
hi Logan begins to tickle no logic in the curvature of the jets? 😉
Still chewing those, Marcoone.
As for geometries, unavoidable is that parabolic carving at Aten, suggesting a life full of creation-destruction.
For those eagerly awaiting information about the electric and magnetic environent of 67P/C-G, here links to abstracts of the EGU2015 conference.
https://meetingorganizer.copernicus.org/EGU2015/EGU2015-13062.pdf
https://meetingorganizer.copernicus.org/EGU2015/EGU2015-2604-1.pdf
https://meetingorganizer.copernicus.org/EGU2015/EGU2015-2991.pdf
Beyond these phenomenons, there is much more to learn:
https://meetingorganizer.copernicus.org/EGU2015/orals/17358
Thanks for the links Gerald. Just glancing at the first abstract it is clear that your judgement about the insignificance of electrical, magnetic and ion density effects is completely out of touch with the reality.
“10-100 mHz magnetic waves (?) near the comet; electric fields and waves in the range from DC up to 3.5 mHz, and significant plasma density enhancements particularly over the neck of the comet.”
What we need now is some specific results to add to the general statements.
I knew you would be happy to read this. But I think the higher ion density is an effect of ultraviolet radiation and the solar wind interacting with emanating gas, not a cause for the emanation; the cause remains sublimation of ices mainly by heat due to solar illumination.
What “solar illumination”? Several of those impressive curving jets appear to be coming out of the shade of the cliffs on either side of Hapi Valley. And we know that the neck region receives, relatively speaking, much less sunlight than the two lobes, where activity is smaller by magnitudes.
This fundamental paradox still needs to be explained, along with that of the considerably higher temperatures detected by VIRTIS all along the bottom of Hapi Valley despite it being in shade much of the time because of those enclosing cliffs on either side: https://www.flickr.com/photos/130179313@N03/16524318826/
https://www.flickr.com/photos/130179313@N03/15927644524/
The 2014 AGU Fall Meeting abstracts, the slides refer to, don’t see a paradox; they just infere the surface properties:
https://agu.confex.com/agu/fm14/meetingapp.cgi#Paper/20954
https://agu.confex.com/agu/fm14/meetingapp.cgi#Paper/21134
The dust thermal properties, also referred to in the slides, are early guesses:
https://agu.confex.com/agu/fm14/meetingapp.cgi#Paper/21657
With a few hundered Watts per square meter you don’t need much time to sublimate ice, or even dry ice, exposed to the vacuum. Other surfaces may have already been dried by the Sun during the previous perihelion phase.
So I don’t see the paradox you’re trying to construct.
This solar illumination of Hapi:
https://blogs.esa.int/rosetta/files/2015/03/ESA_Rosetta_NAVCAM_20150306T152603_annotated.jpg
You may think that Gerald but you are simply choosing the explanation which appeals to you. Why would photoionisation ( a weak effect anyway) be more active in the region over the neck and not elsewhere where there is much more incident sunlight. Actual data is needed. Then it can be judged whether the specific ions detected and the quantities of them are consistent or not with the secondary effect of photoionisation.
There is more illumination in the neck region as you may presume.
Ultraviolet radiation is the same wherever there is direct sunlight. The difference is the higher amount of available gas able to be ionized. Therefore it’s the more active neck region, where the most ions are found.
That’s straightforward. If there are deviations from this, it may need a closer look, e.g. the role and shielding of solar wind, ion pickup etc.
But I agree, quantitative data will help to resolve the details.
Thanks Gerald… [Who is preparing the textbook’s pyre? 😉 ]
Wait for the true fireworks near perihelion. 🙂
To avoid misunderstandings read this abstract “Modeling of the illumination driven coma of 67P/Churyumov-Gerasimenko”:
https://meetingorganizer.copernicus.org/EGU2015/EGU2015-7299.pdf
Evidence of water ice exposure:
https://meetingorganizer.copernicus.org/EGU2015/EGU2015-9489.pdf
No evidence of water ice exposure in this one Gerald. This is the application of a speculative model and an interpretation based on the assumption that the model represents what is happening on the nucleus. If you think about it there are much more obvious explanations for the observed bright spots. Forget the optimistic models and asses the bright spots with the instrumentation that is there on the orbiter.
” The brightness of these spots is up to ten times the average brightness of the surrounding terrain and multi-spectral analyses show a significantly bluer spectrum over the 0.3-1µm range.”
That has been done by “instrumentation that is there on the orbiter.” And it’s what has been expected for an exposure of an ice/dust mix at the surface.
Ten times 7% albedo?
Sounds like a light greyish blue, less like the color of charcoal or basaltic silicate rock.
A bluer spectrum is not evidence of ice Gerald. Interestingly though it overlaps the near ultraviolet range and uv radiation is characteristic of electric arc discharge.
originialjohn, the range is just the filter spectrum, where measurements have been done.
1µm is btw. the wavelength of near infrared.
So they measured from near infrared to near ultraviolet.
The source of the light is the Sun, reflected by the surface of the comet, the very basic principle of the color of a surface.
” The comet nucleus appears to be a body of low mass, low density and high porosity
with approximately four times more dust than ice by mass and 1.5 times more dust than ice by volume.”:
https://meetingorganizer.copernicus.org/EGU2015/EGU2015-10485.pdf
What is the evidence Gerald for “high porosity”
Composition, mass, and volume. Mass and volume return a density of a little below 0.5 g/cm³. Ice and dust, no matter which precise ratio, have a bulk density above 1.0 g/cm³. So we know, that the porosity is above 0.5; the higher the assumed dust portion, the higher the resulting porosity. More realistic is a bulk density of about 2.0 g/cm³ (or a little more) due to the dust, which would result in a porosity of about 0.75 (or a little more).
Hence the nucleus is rather fluffy in its interiour.
Mass has been determined by Rosetta’s trajectories. Volume has been determined by the shape model of the comet, after analysing the images.
This is porosity by inference Gerald. It is not evidence. Evidence would be an image of pores or some other interaction characteristic of pores.
It’s porosity by straightforward calculation and definition.
Gerald, porosity cannot be calculated from volume, mass and density. And the composition of the interior of the nucleus is assumed not demonstrated. Porosity as an explanation for low mass, and hence density, is also an assumption. If the interior was porous some of the surface imagery would be expected to show porosity and none of it does, even at the neck cliff which is a cross section to a depth of about 1000 metres.
What the calculation does suggest is a mass anomaly. All the evidence so far indicates that the nucleus is solid dense rock, igneous in character.
How to calculate porosity from density information: Read the last paragraph of this Wikipedia subsection:
https://en.wikipedia.org/wiki/Porosity#Porosity_in_earth_sciences_and_construction
The density of a solid dense igneous rock is above 2.5 g/cm³. The mean density of the comet nucleus is below 0.5 g/cm³. Hence the comet nucleus isn’t a solid dense igneous rock. Measurement, and simplest logic.
Your “mass anomaly” is called porosity.
If pores aren’t visible from orbit, all you can conclude is, that there are no large pores at the surface. But a snow-like structure in the interiour mixed with dust is very well consistent with the measurements.
The porosity parameter doesn’t tell the size of the pores, just the ratio of void volume devided by the total volume of the considered object.
Btw, look at the almost fractal surface of the comet. Does this look like a close to homogenious solid rock?
@ Gerald
“Btw, look at the almost fractal surface of the comet. Does this look like a close to homogenious solid rock?”
In a word, Yes.
(But BTW, I thought that any reference to Earth-like similarities based on first hand ocular evidence was to be immediately rejected, as being “totally irrational” or “utter nonsense”…).
THOMAS, as you say, taking a comet for a homogenious solid rock is “utter nonsense”.
Many thanks for the link Gerald; I wish we had full text!
So it looks as if its on the verge of forming a bow shock, which is pretty much what the models suggest. Could still take a while depending on outgassing rates.13062
And the ice has probably come out of hiding 🙂
Personally I prefer the opinion of an expert team of researchers who know the details to…..other views. However they make it quite clear its not proof, just the most likely interpretation. 9489
Digging through a lot of them nowhere seems to give a current outgassing rate. Indeed an awful lot of those abstracts look written *not* to contain any actual results, a not uncommon tactic I fear. (Yes, Ive donme it myself!)
Perhaps the strongest evidence for high porosity is simply the density, below 0.5g/cc in old money; how exactly could you reach that *without* porosity? Interestingly 10485 answers a question I posed a while back, is the ‘orbit’ (paraphrase) data good enough for any modelling of internal structure; it clearly is (though it wont have CONSERT resolution, we currently have very, very little CONSERT data.)
Perhaps the strongest evidence for high porosity is simply the density, below 0.5g/cc in old money; how exactly could you reach that *without* porosity?
The answer is change your point of view… See it through electrical processes and electic gravity.
Dust 2.6 denser than ice. That’s very light dust. Non-polymeric Hydrocarbons? Nitrates? Si Al?
Virtis data suggests (the talk by Capaccioni et al, 12375) “surface made of an association of carbon bearing species and opaque minerals such as sulfides … an absorption band in the 2.9-3.6 um range is present across the entire illuminated surface … its shape and width are compatible with absorptions due to non-volatile organic macromolecular materials, complex mixture of various types of C-H and/or O-H chemical groups.”
Unfortunately the C-H, O-H and N-H bands in that region all tend to overlap in condensed phases, and are rather broad and u informative really. Some inorganics can have bands around there too. So it’s unlikely ever to be much more than ‘is consistent with….’ As opposed to a precise identification..
Bit surprised about the ‘sulphides’ comment, though, you wouldn’t expect sulphide bands at that short a wavelength; indeed mineral sulphides are generally transparent there. Artificial, CVD ZnS for example is commonly used as an infrared optical material, transparent to about 10um.
Ah, fractal Gerald. Now you are talking. It is a characteristic of many rock formations. Have a look at the satellite photographs of all mountain ranges on Earth. There is an explanation for this. I wonder if you can guess what it is.
We will have to disagree about porosity. You think that density is an exclusive function of porosity, I do not. It is used as such in some applied sciences.
No, porosity is a function of two density parameters.
The other way round is a relation, not necessarily a function.
Each of the two density parameters is a function of the other density parameter, and porosity.
One of the sciences porosity is applied to, is geology, the relevant science when talking about porosity of comets.
Details of geological processes on Earth are too far off-topic here.
“four times more dust than ice by mass and 1.5 times more dust than ice by volume”.
Interesting – from these numbers I get a specific gravity of 2.6667 for the dust and 2.0 for the comet as a whole.
For comparison, granite is about 2.6-2.7, sandstone about 2.2-2.8 and coal about 1.1-1.4 (from https://geology.about.com/cs/rock_types/a/aarockspecgrav.htm ).
I cheated a little by using 1.0 as the specific density of ice.
Oops!
I should have said ‘specific gravity’ not ‘specific density’ in that last line.
Great picture, thanks for sharing.
Also the size of the jets coming from area that are in shade is becoming more and more common.
this must be a surprise to the mission
Dave, I think the surprise will turn into literal incomprehension as 67P approaches perihelion and those jets continue to shoot out of increasingly sun-starved parts of the neck region. It will simply be “Game over” for the standard theory.
Calling the equator “sun-starved”??
Are you trying to equate the neck-region with the comet’s “equator”? Correct me if I’m wrong, but I had understood that the plane of the “equator” of 67P was more or less orthogonal with respect to the approximately “north-south” orientation of the neck region. (I find it rather strange BTW to see you arguing from Earth-linked references when at the same time the least suggestion of the nucleus possessing Earth-like characteristics such as its rocky appearance and composition, for example, is usually derided as being “totally irrational” or “utter nonsense”…).
The point I’m making and which will need to be addressed sooner or later is actually very simple: the neck region has been shown by the VIRTIS data to be significantly WARMER than the rest of the comet while at the same time receiving significantly LESS ENERGY FROM SUNLIGHT, on average. Is this not an evident paradox? What is causing the excess heat, since it clearly isn’t exposure to sunlight?
The key to resolve the presumed paradox – as you may already suspect – is the wrong presumption, that the VIRIS image may show the average temperature.
The VIRTIS image is NOT about average temperature, but it’s a snapshot during full solar illumination from the viewpoint of Rosetta.
It would be more tricky, if it would be the mean temperature, but it isn’t.
Btw. the equator is a point for you. 🙂
It doesn’t make too much sense to try to find Earth analogs with such an irregular object.
What I’ve essentially meant is, we need to pay attention when looking at active areas. They may change with changing location of maximum solar illumination. So if another area at the neck may become more active, it’s not necessarily Hapi.
For completeness, here a 3d animation of 67P, showing that the equator is crossing the neck twice (e.g. near 135E), but the north pole is close to the neck, too.
https://planetary.s3.amazonaws.com/assets/images/9-small-bodies/2014/20140814_cg_coordinate_system_slow.gif
So, formally there exist poles and the equator for a rotating object, although it’s not quite as obvious as on Earth.
The point back to me 😉
Hi Gerald,
I’ve already answered you elsewhere on the points you raise here, so I won’t bore people by repeating my counter-arguments yet again.
Thanks for the smiley’s and the score-keeping, even if I don’t really agree with the score-card, as you can imagine! (I’m not at all out to just score points, anyway…).
In any case, I think we can count on 67P to be the supreme arbiter for us all at the end of the day, in a few months time. I’ll be more than “Hapi” to abide by what it has to tell us, one way or the other.
https://blogs.esa.int/rosetta/2015/03/11/cometwatch-6-march-6-hours-later/
Well the game never started for the ‘alternative theories’, which never make quantitative predictions to compare to.
But why would you expect them to yield jets there? This would be a low field, partially screened area ‘electrically’, it has just as much of a problem with jets from that region – & no equivalent of thermal intertia, gas moving internally etc etc to help.
Asside from the usual problems that umpteen signatures of such activity are totally absent, there is no mechanism to provide the H2O, etc etc etc.
@ Harvey
“This would be a low field, partially screened area ‘electrically'”.
Could you explain please: “partially screened “electrrically”” by what “screen”, according to what laws of physics?
Acoording to the standard laws of electrostatics; ie the solutions of Poission’s equation with the appropriate boundary conditions. Most practising physicists would have little problem envisaging the general form of those solutions in their head.
This would assume the surface has some significant conductivity; if it doesn’t, no one has ever explained how the whole ‘discharge’ thing is supposed to work (not that it works if it does conduct.)
If on the other hand it has no significant conductivity, its not screened – but the electric field can point any way it likes.
So which way would you like your assumption?
– it does conduct, then the valley is a low field region, but you have *slightly* less trouble explaining discharges
– it doesn’t conduct, its not screened, but discharges make even less sense, if thats possible, and the field points any direction, no tangential E->0 boundary condiition.
Sorry typos Poisson’s equation. See
https://en.wikipedia.org/wiki/Poisson%27s_equation
Thanks for your answer and especially for the link to Poisson’s equation, Harvey.
From there I went on to the Wiki article on electrostatics, to set it in its context. (I’m not a “practicing physicist”, just a humble citizen scientist with, I believe, a sufficient grasp of a little more than basic principles in various different scientific fields to be able to look at, and comment on, the bigger picture, and above all, to practice intelligent pattern recognition).
I was immediately struck by the diagram of electrostatic induction which illustrates the Wiki article:
https://upload.wikimedia.org/wikipedia/commons/d/d9/Electrostatic_induction.svg, and by the striking similarity to be observed between the curvature of the electrostatic field lines in the diagram and the curvature of many of the jets emanating from the surface of 67P in the image at the top of the page.
I have always been intrigued by the fact that the curvature observed in many of the jets from 67P is consistently more acute immediately after their point of emission (where they emanate perpendicularly from the surface), than further along their length, where they more or less straighten out. (On the other hand, we never see the opposite, i.e. jets which only start to curve further out). The phenomenon is also clearly visible in the following images:
https://blogs.esa.int/rosetta/2015/02/13/last-stop-before-close-flyby-cometwatch-9-february/ (the jet on the far left, which seems to be coming towards us, over our left shoulder),
https://blogs.esa.int/rosetta/2015/02/09/last-waltz-at-28-km-cometwatch-3-february/ (the jet at 9 o’clock on the left, apparently emanating from the cliff-face of Hathor),
spectacularly in https://blogs.esa.int/rosetta/2015/01/16/fine-structure-in-the-comets-jets/ ,
and even in the most recent Cometwatch post: https://blogs.esa.int/rosetta/2015/03/18/cometwatch-14-march/ (look at the base of the jet at 10 o’clock, on the left).
I suspect that in images where we only see straight jets (e.g. https://blogs.esa.int/rosetta/2015/03/13/out-of-the-shadow-cometwatch-9-march/ or https://blogs.esa.int/rosetta/2015/03/11/cometwatch-6-march-6-hours-later/), it is often because the crucial point of origin of the jets, where they discharge *perpendicularly* from the plane of the surface, is masked (by intervening parts of the nucleus or by lighting effects).
I therefore take this strongly inhomogeneous curvature of the jets, by comparison with the Wiki diagram of electrostatic induction, to be a further proof of their electrical nature.
(In the case of “outgassing”, BTW – if I understand the theory correctly- , the form of the curvature should presumably be the opposite, with hypothesized high pressure from subsurface chambers ensuring straight, vertical high-speed emission of gas for some distance before the effect of the comet’s rotation is supposed to start bending the dust-filled gas jets further out, as momentum is gradually lost).
You missed the point, THOMAS. Electric discharge of electrically charged bodies occurs in the areas, where the field lines are densest, i.e. at peaks.
As you can see in the svg you referenced (https://upload.wikimedia.org/wikipedia/commons/d/d9/Electrostatic_induction.svg) the density of field lines is low in the depressions (actually none occur in the graphics). But the jets starting at Hapi start in a depression.
Re ‘not being a physicist’, there is an old saying with much truth in it in these discussion; ‘a little knowledge is a dangerous thing.’ You misunderstand the situation regarding the use of Poisson’s equation completely.
The Wiki article, most diagrams you will find, apply *ONLY TO CONDUCTING ELECTRODES*. That constrains tangential E *at the surface only* to be zero. The wiki diagrams are also (correct) but misleading for this case; you need the field between two distant spheres, not with a roughly symmetrically placed array of odd objects; field lines then ‘curve round’ much more.
If 67P is running high power DC electrical discharges, it presumably must be conducting; heaven knows how, rock & ice are both pretty good insulators. But if it is conducting, the base of the valley will be a low field region, in common parlance ‘partially screened’. So if its conducting – highly improbable – it’s a *little* easier to explain discharges in some ways, but it would strongly suggest they would *NOT* occur from the valley.
If on the other hand it is insulating, all bets are off on what the field looks like. NO constraint to be normal to the surface, it can go any which way. No sensible way to run a DC discharge either.
So whichever way you take the boundary conditions, the purported field is a big problem for ‘discharge’ theories – to add to about twenty more.
Harvey, like most people, you have misquoted and misunderstood Pope, who actually wrote “A little LEARNING is a dangerous thing…”.
But while we’re in the sayings game, might I respond that often scientists “can’t see the wood for the trees”. I don’t accept your implication that citizen scientist like myself have insufficient “knowledge” to understand anything about things like comets and the wider Universe. I actually have a lot of LEARNING and it’s a great help in seeing the bigger, holistic, picture which is the WOOD, and not just individual trees. Above all, I fervently believe in giving priority to the observations as being the only correct basis for the scientific method. An interesting example is provided by the extraordinary jets bending at right-angles in the Cometwatch March 14 featurehttps://blogs.esa.int/rosetta/2015/03/20/cometwatch-14-march-6-hours-later/. I have submitted a couple of comments on them and would be very interested in reading your response, with your interpretation of this phenomenon, on that thread.
(This comment was originally posted on 23/03/2015 at 12:02 and failed to pass moderation, I’ve no idea why…).
The way the jets curve upwards in the top left quadrant but downwards in the bottom right quadrant suggests to me that they are caused by an anti-clockwise rotation of the comet (as seen from this perspective).
If that is the case, it wouldn’t be difficult to calculate the speed of the particles in the jets – all I’d need to come up with a first approximation would be the period of the rotation.
Anyone ?
This picture has a couple of linear objects, one to the left and one to the right of 67P. Is it worth the effort of taking an Osiris image of one of these things?