In a special edition of the journal Science, published online tonight, results are presented from seven of Rosetta’s 11 science instruments made during the approach to and soon after arriving at Comet 67P/Churyumov-Gerasimenko in August 2014.
Our overview article is published on the main ESA Portal and also posted below. A number of supporting blog posts provided by the different instrument teams to give more details of their specific results will also soon be published on the blog. In addition, we are pleased to point you to our “Comet close-ups” image slideshow that focuses on the OSIRIS images presented in the papers – enjoy!
Getting to know Rosetta’s comet
Rosetta is revealing its host comet as having a remarkable array of surface features and with many processes contributing to its activity, painting a complex picture of its evolution.
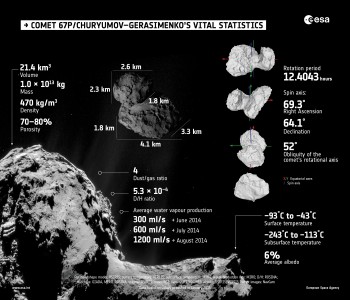
The familiar shape of the dual-lobed comet has now had many of its vital statistics measured: the small lobe measures 2.6 × 2.3 × 1.8 km and the large lobe 4.1 × 3.3 × 1.8 km. The total volume of the comet is 21.4 km^3 and the Radio Science Instrument has measured its mass to be 10 billion tonnes, yielding a density of 470 kg/m^3.
By assuming an overall composition dominated by water ice and dust with a density of 1500–2000 kg/m3, the Rosetta scientists show that the comet has a very high porosity of 70–80%, with the interior structure likely comprising weakly bonded ice-dust clumps with small void spaces between them.
The OSIRIS scientific camera, has imaged some 70% of the surface to date: the remaining unseen area lies in the southern hemisphere that has not yet been fully illuminated since Rosetta’s arrival.
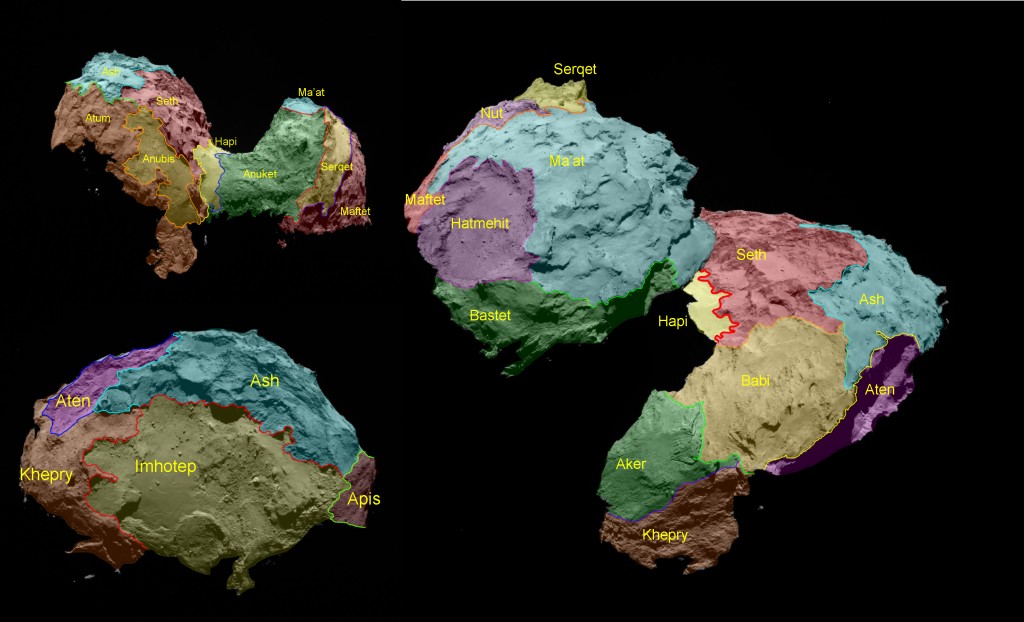
The scientists have so far identified 19 regions separated by distinct boundaries and, following the ancient Egyptian theme of the Rosetta mission, these regions are named for Egyptian deities, and are grouped according to the type of terrain dominant within.
Five basic – but diverse – categories of terrain type have been determined: dust-covered; brittle materials with pits and circular structures; large-scale depressions; smooth terrains; and exposed more consolidated (‘rock-like’) surfaces.
Much of the northern hemisphere is covered in dust. As the comet is heated, ice turns directly into gas that escapes to form the atmosphere or coma. Dust is dragged along with the gas at slower speeds, and particles that are not travelling fast enough to overcome the weak gravity fall back to the surface instead.
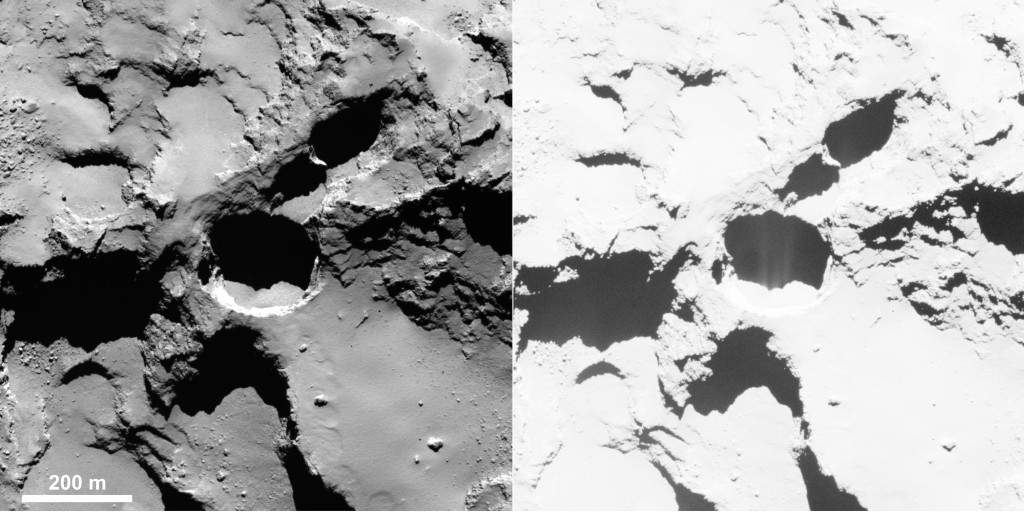
Active pit detected in Seth region of Comet 67P/Churyumov–Gerasimenko. Enhancing the contrast (right) reveals fine structures in the shadow of the pit, interpreted as jet-like features rising from the pit.
Credits: ESA/Rosetta/MPS for OSIRIS Team MPS/UPD/LAM/IAA/SSO/INTA/UPM/DASP/IDA
Some sources of discrete jets of activity have also been identified. While a significant proportion of activity emanates from the smooth neck region, jets have also been spotted rising from pits.
The gases that escape from the surface have also been seen to play an important role in transporting dust across the surface, producing dune-like ripples, and boulders with ‘wind-tails’ – the boulders act as natural obstacles to the direction of the gas flow, creating streaks of material ‘downwind’ of them.
The dusty covering of the comet may be several metres thick in places and measurements of the surface and subsurface temperature by the Microwave Instrument on the Rosetta Orbiter, or MIRO, suggest that the dust plays a key role in insulating the comet interior, helping to protect the ices thought to exist below the surface.
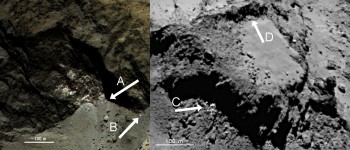
Icy alcoves? A-C point to examples of bright material, while D marks an example of brittle fracturing. Click for more info. Credits: ESA/Rosetta/MPS for OSIRIS Team MPS/UPD/LAM/IAA/SSO/INTA/UPM/DASP/IDA
Small patches of ice may also be present on the surface. At scales of 15–25 m, Rosetta’s Visible, InfraRed and Thermal Imaging Spectrometer, or VIRTIS, finds the surface to be compositionally very homogenous and dominated by dust and carbon-rich molecules, but largely devoid of ice. But smaller, bright areas seen in images are likely to be ice-rich. Typically, they are associated with exposed surfaces or debris piles where collapse of weaker material has occurred, uncovering fresher material.
On larger scales, many of the exposed cliff walls are covered in randomly oriented fractures. Their formation is linked to the rapid heating–cooling cycles that are experienced over the course of the comet’s 12.4-hour day and over its 6.5-year elliptical orbit around the Sun. One prominent and intriguing feature is a 500 m-long crack seen roughly parallel to the neck between the two lobes, although it is not yet known if it results from stresses in this region.
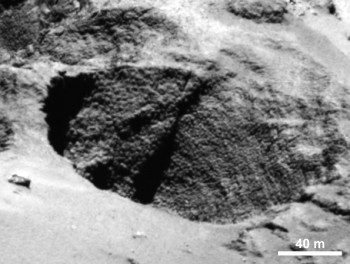
Example of the mysterious features nicknamed “goosebumps”. Credits: ESA/Rosetta/MPS for OSIRIS Team MPS/UPD/LAM/IAA/SSO/INTA/UPM/DASP/IDA
Some very steep regions of the exposed cliff faces are textured on scales of roughly 3 m with features that have been nicknamed ‘goosebumps’. Their origin is yet to be explained, but their characteristic size may yield clues as to the processes at work when the comet formed.
And on the very largest scale, the origin of the comet’s overall double-lobed shape remains a mystery. The two parts seem very similar compositionally, potentially favouring the erosion of a larger, single body. But the current data cannot yet rule out the alternative scenario: two separate comets formed in the same part of the Solar System and then merged together at a later date. This key question will be studied further over the coming year as Rosetta accompanies the comet around the Sun.
How to grow an atmosphere
Their closest approach to the Sun occurs on 13 August at a distance of 186 million kilometres, between the orbits of Earth and Mars. As the comet continues to move closer to the Sun, an important focus for Rosetta’s instruments is to monitor the development of the comet’s activity, in terms of the amount and composition of gas and dust emitted by the nucleus to form the coma.
Images from the scientific and navigation cameras have shown an increase in the amount of dust flowing away from the comet over the past six months, and MIRO showed a general rise in the comet’s global water vapour production rate, from 0.3 litres per second in early June 2014 to 1.2 litres per second by late August. MIRO also found that a substantial portion of the water seen during this phase originated from the comet’s neck.
Water is accompanied by other outgassing species, including carbon monoxide and carbon dioxide. The Rosetta Orbiter Spectrometer for Ion and Neutral Analysis, ROSINA, is finding large fluctuations in the composition of the coma, representing daily and perhaps seasonal variations in the major outgassing species. Water is typically the dominant outgassing molecule, but not always.
By combining measurements from MIRO, ROSINA and GIADA (Rosetta’s Grain Impact Analyzer and Dust Accumulator) taken between July and September, the Rosetta scientists have made a first estimate of the comet’s dust-to-gas ratio, with around four times as much mass in dust being emitted than in gas, averaged over the sunlit nucleus surface.
However, this value is expected to change once the comet warms up further and ice grains – rather than pure dust grains – are ejected from the surface.
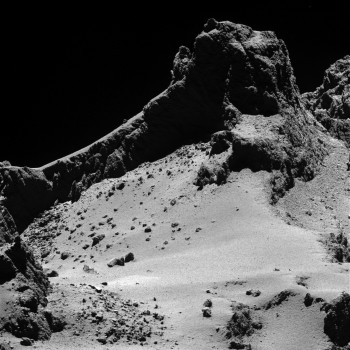
A section of the smaller of Comet 67P/Churyumov–Gerasimenko’s two lobes as seen through Rosetta’s narrow-angle camera from a distance of about 8 km to the surface on 14 October 2014. The resolution is 15 cm/pixel.
Credit: ESA/Rosetta/MPS for OSIRIS Team MPS/UPD/LAM/IAA/SSO/INTA/UPM/DASP/IDA
GIADA has also been tracking the movement of dust grains around the comet, and, together with images from OSIRIS, two distinct populations of dust grains have been identified. One set is outflowing and is detected close to the spacecraft, while the other family is orbiting the comet no closer than 130 km from the spacecraft.
It is thought that the more distant grains are left over from the comet’s last closest approach to the Sun. As the comet moved away from the Sun, the gas flow from the comet decreased and was no longer able to perturb the bound orbits. But as the gas production rate increases again over the coming months, it is expected that this bound cloud will dissipate. However, Rosetta will only be able to confirm this when it is further away from the comet again – it is currently in a 30 km orbit.
As the gas–dust coma continues to grow, interactions with charged particles of the solar wind and with the Sun’s ultraviolet light will lead to the development of the comet’s ionosphere and, eventually, its magnetosphere. The Rosetta Plasma Consortium, or RPC, instruments have been studying the gradual evolution of these components close to the comet.
“Rosetta is essentially living with the comet as it moves towards the Sun along its orbit, learning how its behaviour changes on a daily basis and, over longer timescales, how its activity increases, how its surface may evolve, and how it interacts with the solar wind,” says Matt Taylor, ESA’s Rosetta project scientist.
“We have already learned a lot in the few months we have been alongside the comet, but as more and more data are collected and analysed from this close study of the comet we hope to answer many key questions about its origin and evolution.”
These are among the very first scientific results from Rosetta and there is much more to come as the scientists work through the data and as the comet continues to evolve during its closest approach to the Sun. They are described in more detail in accompanying posts (to be published after this post and tomorrow) and in the 23 January 2015 Science special edition (reference below):
“Dust Measurements in the Coma of Comet 67P/Churyumov- Gerasimenko Inbound to the Sun Between 3.7 and 3.4 AU” by A. Rotundi et al. (GIADA; read our blog post here)
“Subsurface properties and early activity of comet 67P/Churyumov-Gerasimenko” by S. Gulkis et al. (MIRO; read our blog post here)
“The Morphological Diversity of Comet 67P/Churyumov-Gerasimenko” by N. Thomas et al. (OSIRIS)
“On the nucleus structure and activity of comet 67P/Churyumov-Gerasimenko” by H. Sierks et al. (OSIRIS)
“Time variability and heterogeneity in the coma of 67P/Churyumov-Gerasimenko,” by M. Hässig et al. (ROSINA; read our blog post here)
“Birth of a comet magnetosphere: a spring of water ions,” by H. Nilsson et al. (RPC-ICA; read our blog post here)
“67P/Churyumov-Gerasimenko: The Organic-rich surface of a Kuiper Belt comet as seen by VIRTIS/Rosetta” by F. Capaccioni et al. (VIRTIS; read our blog post here)
More images available in the main news story – and don’t forget to check out the OSIRIS image slideshow, too!



Discussion: 42 comments
OMG ! It’s christmas time !!
That’s exactly how I felt when I saw all these goodies yesterday! Oh my goodness – which present to open first?!
re: Active pit detected in Seth region
is the seth region’s (or other regions) jets appearance on the image due to 1) the dust or 2) ionized gas? I guess the dust image is reflected sunlight.
Mass 1 e 13 kg, average mass loss rate 1 kg/s.
Divided by (60*60*24*365) [seconds in a year] gives a duration of 317,000 years until its all gone. Right?
Does that in turn imply that 317,000 years ago its mass was 2 e 13 kg? A million years ago 6 e 13 kg?
Seems a very high loss rate for something which has been around for say two billion years.
Looking back then two billion years ago the comet had a mass of 2 e 9 *(60*60*24*365) = 6.3 e 16 kg, compared with the Solar System’s total present mass of 2 e 30 kg?
Don’t forget that the comet is inactive most of the time on it’s 6 year orbit and that it has only been coming that close to the sun for a few dozens of year.
The mass loss law is far from being linear !!
Comets are Kuiper belt objects that have had their orbits sufficiently perturbed to approach closer to the sun – and in this case jupiter. 300,000 years ago it was somewhere out past Pluto and wasn’t losing any mass.
May have been “out there” beyond the orbit of Neptune for a couple of billion years before being perturbed sunwards.
Nice to see a big update. Reading the papers it does seem like there is still a lot left unknown. It might be worth pointing out that these are papers built upon what they knew by September last year (or early October at most). It will (probably) be a whole lot easier to put things into context and try to understand them after perihelion.
Ultimately we might have to wait quite a while yet until they are ready to give any extensive explanations of what we see.
Again, It’s wonderful to read the papers starting to come out! I spent most of the last evening reading and drooling on my keyboard.
And we now know names and can describe where features are. The downside is that it’s going to be fun converting my “whimsical in-house names” to the formal ones. I am working my way through the _Rocky and Bullwinkle_ pantheon… 🙂
More today. Oh my.
–Bill
When I read the newly named areas I’m finding myself picturing the individual gods sitting in their patches! Ma’at, Anubis, Bastet and Seth I have immediate mental images for, but the others are just names. So along with reading the Science special issue (and is it REALLY not paywalled?
What happened to the rest of my post?
I just said that I’m improving my knowledge of Egyptian mythology, but it was cut off!
@Margarita, my experience tells me, if you use special signs, smileys etc. the reply is truncated at the illegal sign.
Absolutely wonderful stuff – almost too much at one time for mere mortals to take in. But I’ve not seen anything which supports the EU model, or have I missed it amongst the wealth of detail. References to the papers in science might help I suppose.
Brilliant to have all this to look at, read and perhaps understand. .the jury is still out on whether 67P was originally two (or more) separate bodies. Can I plump for three with the smallest being squashed into the neck?
WOW!
Thank you Emily, you have been busy. Like Bill, I have been transfixed by all the information. Just about sorted out the written stuff, learning all those names and what terrain they are associated with is going to be a task. I will have to print out the pretty pictures to keep nearby for reference. Not examined the images in detail, but at last we do have a few full resolution OSIRIS images to examine, not exactly recent, but hey, they are very welcome.
At last we know what the “dinosaur eggs” look like, but it seems the preferred term is “goosebumps”. What many of the results based on visual data show is that the NAVCAM images the ESA team have been letting us enjoy, are highly useful scientific imaging, much of what the OSIRIS team are reporting is what between us we have deduced from the NAVCAM images. No wonder Holger and the team are not so forthcoming with images.
So many of our tentative and speculative theories turn out to be viable, Jacob’s giant hailstones, fluids flowing on the surface, dunes formed by sublimation gas flows, sliding cliff faces, the dust as sublimation residue and a few more. Of course we all know they took all their ideas from us. 😉
One thing we all had difficulty with was understanding the gravity vectors. The lovely figure showing the gravity and the affect of the slopes on the terrain was most illuminating. It would appear that the rotation of 67P is sufficient to reduce the gravity on the heads of the lobes to about half that near the neck region and that local gravity vectors on some slopes is 45 degrees or more from perpendicular to the surface. It certainly is turning out to be a very strange and fascinating little world.
Thanks to all the teams for their great work, we enjoy seeing the results just as much as I’m sure they do uncovering them. Thanks to Science for making these articles available free on line straight away too. Sorry Daposter you only needed to register with the AAAS, not subscribe to the Journal.
Plasma is the ‘default’ state of matter, the say goes. Is ‘solid’ the default state of matter in the interstellar space? 😉
Ups, [touched cosmology]. Should say:
Excluding Hydrogen and Helium, …
Hi. It appears they have placed the neck cracks https://www.sciencemag.org/content/347/6220/aaa1044/F7.expansion.html
In the Hapi region when they appear to all be in the Anuket region. This should be quite obvious as the Hapi region appears covered in dust and “horizontal”, and the Anuket region is sloped and solid.
You can see the cracks in the Anuket region on this map:
https://www.sciencemag.org/content/347/6220/aaa1044/F3.large.jpg
Also, Hathor is missing from the coloured maps. It is the most interesting part, with the steep gravitational gradient and straight lines running up the cliff-face under the head. It’s almost as if the scientists were least keen to show the features they could least explain:-) At least while they have a blind spot for stretch theory……
Hi Marco, Hathor is labeled in this one: https://www.esa.int/spaceinimages/Images/2015/01/Getting_to_know_Rosetta_s_comet_region_maps; and the lineaments are in fact described in more detail in the Thomas et al. paper.
As for the crack then it extends from Hapi into Anuket as seen in the image and explained in the caption that you posted the link to (also here: https://www.esa.int/spaceinimages/Images/2015/01/A_crack_in_the_comet)
It might seem a bit nit picky, but the borderline between Hapi, Anuket and Hathor is quite unclear. In the map link, the lineaments are barely visible. My impression also was that the Hapi area is covered with a blanket of dust, while Anuket is the solid surface exposed, so a crack extending from Hapi to Anuket seems as presumptious as saying a crack on a sand dune extends to the nearby rocky outcrop. The most that can be said is that the linear feature on Hapi is probably related to the parallel cracks on Anuket, and that the crack may continue under the dust.
I shall look for the Thomas et al paper. Is it behind a paywall?
Hi Marco, sorry, I should have posted the link to the paper; it’s available here: https://www.sciencemag.org/content/347/6220/aaa0440.full Figure 4 shows how the team are mapping the lineaments in Hathor.
Hi Emily, I know that moderation needs to happen, and it is ok. It is just that it seems the conversations in the market of new ideas seems to have been cut off completely. There are some ideas floating about alternative explanations specifically for Imhotep, Hatmehit and Hathor – also for the neck cracks in Anuket and Hapi. Can you suggest how I could word a comment that would start such a conversation without it being moderated?
Thank you. Yes, the lines are mapped, and the interfaces between those regions are explained there. No explanation of how parallel lines that long are formed on a shear cliff, but stretch theory has got that covered.
Marco, there are countless examples down here on Earth of long “parallel lines […] formed on a sheer cliff”, e.g. https://www.americansouthwest.net/slot_canyons/paria_river/pariacliff_l.html
(this was the very first example my googlesearch threw up, there are tons more, of course…).
No need whatever for your highly speculative “stretch theory”.
Hi THOMAS, I was hoping to engage with you again. These lines on Hathor are in a roughly perpendicular direction to the strata that is apparent on the rest of the head, and for that matter, the body. The lines on the sheer cliff you offer are the strata lines on that part of the rock, exposed vertically due to the tectonic history of the area turning them 90 degrees. The fact that there is strata in 67P is somewhat indicative of it being a fragment of a much larger body, but these lines are completely different from the strata lines on 67P and in an orthogonal direction. A different cause other than “sedimentary deposition” is called for.
Sorry THOMAS,
The link you offered among many others are composed of stripes of “desert varnish” a micrometer thick layer on desert rock. Are you suggesting the same source? Or a similar process?
@THOMAS, I think pulling out a random picture of vertical lines on a cliff is like me saying “you don’t need EU theory to explain 97P’s shape. Look- a duck!”
Link to an image of a living duck.
Hi Marco (replying to the comment above but for some reason no reply button for me!) — not sure if there is a specific comment you are referring to that has been moderated out but I know some things can automatically end up in the spam filter (or alternatively just take a while for us to approve during busy periods).
Discussions welcome on related topics!
Thanks Emily,
Do what you can. I know time constraints and spam make it hard. Moderation delayed can sometimes be conversation denied. Thanks again for responding personally also.
Hi Marco,
You write “I think pulling out a random picture of vertical lines on a cliff is like me saying “you don’t need EU theory to explain 97P’s shape. Look- a duck!””
I readily concede your point here: it really was the first picture I came across and I didn’t look closely enough at it. Mea culpa.
I actually expressed my true opinion on this issue in the response I made to you on the “Extremely-dark-dry-and-rich-in-organics-virtis-view-of-67pc-g” thread: https://blogs.esa.int/rosetta/2015/01/23/extremely-dark-dry-and-rich-in-organics-virtis-view-of-67pc-g/#comment-356211 (currently still awaiting moderation).
If I may quote part of what I said:
“I believe that the “vertical” strata seen in the cliffs on either side of 67P’s neck canyon (and everywhere else on the comet…) are more comparable to the “horizontal” strata observed everywhere on the cliff-faces imaged by NASA in the Valles Marineris canyon on *Mars*:https://www.jpl.nasa.gov/spaceimages/details.php?id=PIA17570 (Just flip the image through 90° for easier comparison).”
THOMAS, there are significant issues with the claim that the lines on Hathor cliff are anything like the strata seen on rocky planets like Mars or Earth. A quick visual reality check on the claim will demonstrate. The lines on Hathor appear to be *surface features* as they don’t follow through in a parallel way to any other visible part of the comet. The parallel plains that *do* look like strata are orthogonal to the lines on Hathor. In this sense Hathor lines are more similar to the desert varnish lines, than strata lines. Note that the parallel strata plains on the head lobe are at around a 30 degree angle to those apparent on the body lobe. Thus if 67P formed from a chunk of a larger body, it has since “bent at the neck” most likely when the neck formed vi rotational accelerations.
@ Marco
“THOMAS, there are significant issues with the claim that the lines on Hathor cliff are anything like the strata seen on rocky planets like Mars or Earth. A quick visual reality check on the claim will demonstrate. The lines on Hathor appear to be *surface features* as they don’t follow through in a parallel way to any other visible part of the comet. The parallel plains that *do* look like strata are orthogonal to the lines on Hathor.”
Actually, I believe it is the *horizontal* “lines” on Hathor which are certainly “surface features” and maybe even the vertical features too…
I’m not sure what you mean by “lines”, BTW. What a quick visual reality check shows in the image of the Hathor cliff https://d1jqu7g1y74ds1.cloudfront.net/wp-content/uploads/2014/08/Comet_on_7_August_a.jpg is that several of the horizontal “lines” are actually lines of several side-by-side *drill-holes* which I take to be the result of electrical etching through arc-mode discharge activity.
This phenomenon can already be seen in several places at a very large scale (from over 100 kms…); the diameter of the holes must be at least 10m. Statistically, these can hardly be chance alignments. They can also be seen at a smaller scale by zooming in, with lines of holes of considerably smaller diameter. Interestingly, when you flip the image through 90°, you can see that the “vertical” lines are *also* made of juxtaposed drill-holes in many places, with the holes actually overlapping in some places, such that the separating walls between juxtaposed holes have disappeared, leaving what looks like a long crack with side-by-side bulges in the rock on either side. (I used to involuntarily achieve the same sort of effect as a young boy when, on sunny summer days, I used a magnifying glass to focus the Sun’s rays and burn patterns onto lollipop sticks: if I stayed a couple of seconds too long at particular places, the black line I was burning showed exactly the same sort of bulges).
And to complete the picture, there are, to the bottom left of the Hathor cliff, *diagonal* lines (running 10 o’clock – 4 o’clock) made up of the same drill-hole features. More generally, when you look closely, the juxtaposed/overlapping drill-hole phenomenon also accounts for the alleged “crack” in the neck region, which is thus also only a mere “surface feature”, again produced by electric arcing: https://www.esa.int/spaceinimages/Images/2015/01/A_crack_in_the_comet.
Series of 3 – 5 aligned drill-holes aligned vertically or horizontally, are ubiquitous on 67P, at whatever scale. At a medium scale, they can be seen everywhere in the famous image of the canyon (taken from 62 km) separating the two lobes of the comet: https://www.esa.int/spaceinimages/Images/2014/09/Comet_on_5_September_2014. Perhaps most spectacularly though, they are clearly visible at a very small scale in the clearest CIVA image which Philae managed to send back to us before hibernating: https://www.esa.int/spaceinimages/Images/2014/11/Welcome_to_a_comet. The aligned holes here are a matter of mere millimetres in diameter. This is all yet another proof that the electric force is totally scalable.
And even more interestingly, these drill-holes are also visible in rock “strata”, also at very different scales, *on Mars*:
-at a very large scale: https://www.jpl.nasa.gov/spaceimages/images/largesize/PIA17570_hires.jpg, where the aligned holes must be many metres in diameter.
-and at a very small scale: https://www.nasa.gov/jpl/msl/pia19074/#.VNczC-bF8uc, where, according to the scale provided, the holes can again measure only millimeters.
The archetype of this sort of electrically machined surface-feature can be seen, not on a rock face but on a flat land surface, again on Mars: https://www.thunderbolts.info/wp/2012/12/12/martian-electric-augers/. I guess the standard theory has to call these “impact craters”….
The cracks on Anuket really don’t make sense for a contact binary. I have read through as many science papers that I could find that try to explain the shape, and they seem to have a blind spot for the possibility of stretch due to fast rotation, which elegantly explains the position and alignment of the cracks. https://scute1133site.wordpress.com/2015/01/22/67pchuryumov-gerasimenko-a-single-body-thats-been-stretched-part-11/
The colors denote a comparison to being through a paintball skirmish. Layers gathered over time in a field of light debris…It is my understanding that old star explosion events can sweep the area of the event fairly clean of debris. One would assume loosely that these lighter materials would settle out closer to the original event site, than heavier fragments left for next generation solar system bodies formation. Perhaps this comet more represents materials in the near-by Centauri system.
I have seen similar “goosebump” remains within the walls of sawdust furnaces (image search: “sawdust pile fire”). Organic debris piles the size of sawdust hills at sawmills, down to the size of small compost piles, generate tremendous heat at their cores. Cold outer layering would greatly insulate such hot cores.
Does anyone know if an animation has been presented showing how temperature changes, by region, on the surface of 67/P as the comet revolves?
Anyone care to take that project on?
Has there been enough information released to do such a project?
.
@ Wayne
The only released information I know of concerning temperature differences by region is that which was briefly communicated by Fabrizio Cappacioni during the Virtis presentation at the AGU meeting in December: https://virtualoptions.agu.org/media/P32B-07.+Rosetta+2014+I%2C+Presented+By+Fabrizio+Capaccioni/0_eb9d69c6
(If you haven’t yet used the AGU Virtual Options, free registration is required).
I commented on this in a reply I made to Robin Sherman a few days back (https://blogs.esa.int/rosetta/2015/01/23/comet-pouring-more-water-into-space/#comment-348839) on the ‘Comet Pouring More Water Into Space’ thread.
If I may quote from what I wrote then:
“What I find much more interesting and significant in the VIRTIS video are the temperature findings. As of ~4:20, we see a rapid succession of images (too rapid to be able to study them without constant freeze-framing…) showing differences in surface temperatures. What I find particularly extraordinary are the images of 1/ (at 4:21 and 4:23) a 1km+long strip of considerably higher temperature running in a near-straight line from one end to the other of the floor of the neck region and 2/ (at 4:31) a similarly extensive area of much higher temperature spreading all along the base of the towering Seth cliff.
Even more astounding, though, is that Fabrizio Cappacioni makes no comment on these images and on the fact that the hotter areas they demonstrate manifestly correspond precisely to the area which has clearly been generating the most vigorous jetting activity since ROSETTA arrived at the comet (and which the EU proponents on this blog have consistently ascribed to electric glow discharge activity). The on-screen commentary simply states: “67P morphology induces large shadowing effects and strong thermal gradients, in particular in the neck region”. Nowhere is it pointed out that the large-scale area where surface temperatures are consistently the highest is precisely the largest extended area on the illuminated part of the comet which necessarily receives the least sunlight, being at the bottom of towering cliffs on either side. This is decidedly a huge embarrassment for the standard “sublimating ice” theory.
It would be nice if these images were more widely disseminated and interpreted by the VIRTIS team.”
As I say, and as far as I know, this is the only information which has been released ‘recently’, and the observations date back to September… And evidently *nobody* in the mainstream camp is hustling to give them any wider publicity or even comment on them: one wonders why they were even so fleetingly flashed up on the screen. So your expectation that information has been released on actual *changes* in temperature over time is a forlorn one. But maybe there will be an update in a few months…
Have a look at the passages in the video I pointed to anyway, they’re an eye-opener: then draw your own conclusions.
Is it now possible to give, along with images, a statement like “Sun overhead Imhotep” so that one can form a good idea of the solar angle at the time the image was taken?
Somewhere around the coldest, darkest quieter places surrounding our galaxy there are myriads of small celestial bodies, ethereal as if made from the lightest of the feathers, created across uncountable millenniums, destroyed by the minimal disturbance. Those are the real primordial comets.
“…interpreted as jet-like features rising from the pit.”
Or sand falling down from the pit’s ceiling. Look how the form of the shadow’s lower line follows the ‘bar pattern’ of the ‘features’.
And the Planetary Society finally has a rundown on the AGU talks. which parallel these _Science_ articles:
https://www.planetary.org/blogs/emily-lakdawalla/2015/01260947-rosetta-science-results.html
–Bill