Using the Microwave Instrument for the Rosetta Orbiter (MIRO), scientists have studied the comet’s southern polar regions at the end of their long winter season. The data suggest that these dark, cold regions host ice within the first few tens of centimetres below the surface in much larger amounts than elsewhere on the comet.
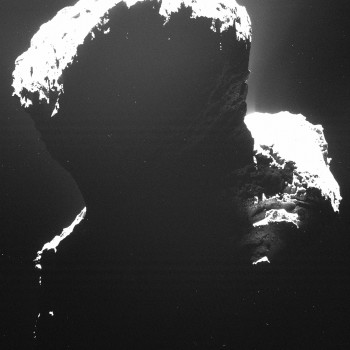
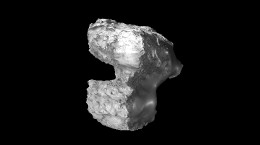
Image of the southern polar regions of Comet 67P/C-G taken with Rosetta’s OSIRIS imaging system on 29 September 2014, when they were still experiencing the long southern winter. Credits: ESA/Rosetta/MPS for OSIRIS Team MPS/UPD/LAM/IAA/SSO/INTA/UPM/DASP/IDA ESA/Rosetta/MPS for OSIRIS Team MPS/UPD/LAM/IAA/SSO/INTA/UPM/DASP/IDA
Since its arrival at Comet 67P/Churyumov-Gerasimenko, Rosetta has been surveying the surface and the environment of this curiously-shaped body. But for a long time, a portion of the nucleus – the dark, cold regions around the comet’s south pole – remained inaccessible to almost all instruments on the spacecraft.
Due to a combination of its double-lobed shape and the inclination of its rotation axis, Rosetta’s comet has a very peculiar seasonal pattern over its 6.5 year-long orbit. Seasons are distributed very unevenly between the two hemispheres, each of which comprises parts of both comet lobes and of the ‘neck’.
For most of the comet’s orbit, the northern hemisphere experiences a very long summer, lasting over 5.5 years, and the southern hemisphere undergoes a long, dark and cold winter. However, a few months before the comet reaches perihelion – the closest point to the Sun along its orbit – the situation changes, and the southern hemisphere transitions to a brief and very hot summer.
When Rosetta arrived at 67P/C-G in August 2014, the comet was still experiencing its long summer in the northern hemisphere and regions on the southern hemisphere received very little sunlight. Moreover, a large part of this hemisphere, close to the comet’s south pole, was in polar night and had been in total darkness for almost five years.
With no direct illumination from the Sun, these regions could not be imaged with Rosetta’s OSIRIS science camera. In addition, their low temperatures – ranging between 25 and 50 degrees above absolute zero – did not allow observations with VIRTIS, the Visible, InfraRed and Thermal Imaging Spectrometer, either.
For the first several months after Rosetta’s arrival at the comet, only one instrument on the spacecraft could observe and characterise the cold southern pole of 67P/C-G: the Microwave Instrument for the Rosetta Orbiter (MIRO).
In a paper accepted for publication in the journal Astronomy and Astrophysics, scientists report on the data collected by MIRO over these regions between August and October 2014.
“We observed the ‘dark side’ of the comet with MIRO on many occasions after Rosetta’s arrival at 67P/C-G, and these unique data are telling us something very intriguing about the material just below its surface,” explains Mathieu Choukroun from NASA’s Jet Propulsion Laboratory, lead author of the study.
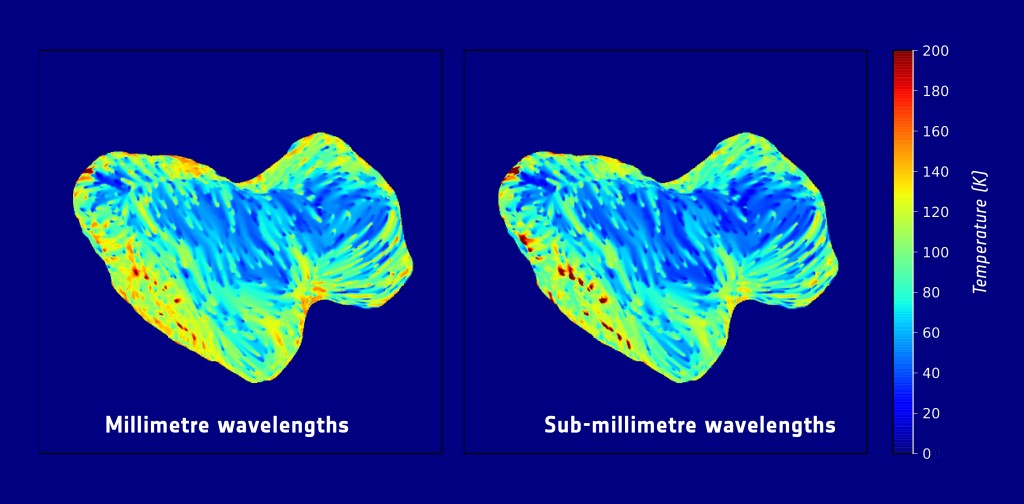
Subsurface temperature maps of 67P/C-G, showing the southern hemisphere of the comet. The maps are based on observations obtained with MIRO at millimetre (left) and sub-millimetre (right) wavelengths between September and October 2014; the data are projected on a digital shape model of the comet. Credits: ESA/Rosetta/NASA/JPL-Caltech
Observing the comet’s southern polar regions, Choukroun and colleagues found significant differences between the data collected with MIRO’s millimetre and sub-millimetre wavelength channels. These differences might point to the presence of large amounts of ice within the first few tens of centimetres below the surface of these regions.
“Surprisingly, the thermal and electrical properties around the comet’s south pole are quite different to what is found elsewhere on the nucleus. It appears that either the surface material or the material that lies down to a few tens of centimetres below it is extremely transparent at the MIRO wavelengths of 0.5 and 1.6 mm, and could consist mostly of water ice or carbon-dioxide ice,” he adds.
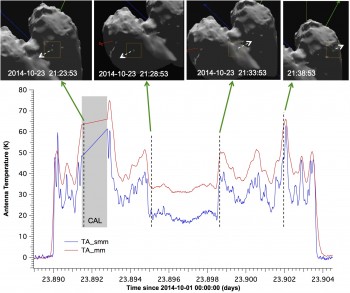
This graph shows the antenna temperatures measured by MIRO during two consecutive scans of Comet 67P/C-G’s southern polar regions, performed on 23 October 2014, at millimetre (red) and sub-millimetre (blue) wavelengths. The series of images on the top, obtained from the digital shape model of the comet, show the various portions of the nucleus that were surveyed in these scans. The grey shaded area in the graph indicates a calibration interruption of the data. From M. Choukroun et al., Astronomy & Astrophysics, 2015.
The difference between the surface and sub-surface composition of this part of the nucleus and that found elsewhere might originate in the comet’s peculiar cycle of seasons. One of the possible explanations is that water and other gases that were released during the comet’s previous perihelion, when the southern hemisphere was the most illuminated portion of the nucleus, condensed again and precipitated on the surface after the season changed and the southern hemisphere plunged again into its long and cold winter.
These are, however, preliminary results, because the analysis depends on the detailed shape of the nucleus, and at the time the measurements were made the shape of the dark, southern polar region was not known to great accuracy.
“We plan to revisit the MIRO data using an updated version of the digital shape model, to verify these early results and refine the interpretation of the measurements,” adds Choukroun.
Besides, Rosetta scientists will be testing these and other possible scenarios using data that were collected in the subsequent months, leading to the comet’s perihelion, which took place on 13 August 2015, and beyond.
In May 2015, the seasons changed on 67P/C-G and the brief, hot southern summer, which will last until early 2016, began. As the formerly dark southern polar regions started to receive more sunlight, it has been possible to observe them with other instruments on Rosetta, and the combination of all data might eventually disclose the origin of their curious composition.
“In the past few months, Rosetta has flown over the southern polar regions on several occasions, starting to collect data from this part of the comet after summer began there,” explains Matt Taylor, ESA Rosetta project scientist.
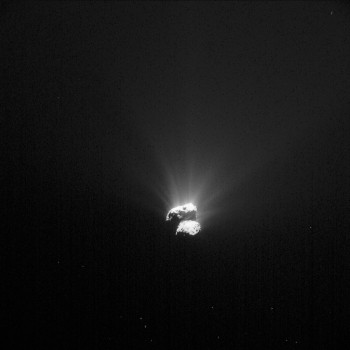
The southern hemisphere of Comet 67P/C-G, in a NAVCAM image taken on 26 August 2015. Credits: ESA/Rosetta/NAVCAM – CC BY-SA IGO 3.0
“At the beginning of the southern summer, we had a paucity of observations in these regions as Rosetta’s trajectory focussed on the northern hemisphere due to ongoing communication with the lander, Philae. However, closer to perihelion we were able to begin observing the south.
“Rosetta is currently on an excursion out to 1500 km from the nucleus to study the comet’s environment at large, but it will soon come closer to the comet, focussing on full orbits to compare the northern and southern hemispheres, as well as some slower passes in the south to maximise our observations there. In addition, as activity will start to wane later this year, we hope to get closer to the nucleus and gain higher resolution observations of the surface.”
Mark Hofstadter, MIRO Principal Investigator at NASA’s Jet Propulsion Laboratory, describes the result as “a great example of how the scientific process unfolds as Rosetta is studying the evolution of this comet up close.”
“First, we observed these dark regions with MIRO, the only instrument able to do so at the time, and we tried to interpret these unique data. Now, as these regions became warmer and brighter around perihelion, we can observe them with other instruments, too,” he adds.
“We hope that, by combining data from all these instruments, we will be able to confirm whether or not the south pole had a different composition and whether or not it is changing seasonally.”
This blog post is based on the paper “The “Dark Side” of 67P/Churyumov-Gerasimenko in Aug-Oct 2014 – MIRO/Rosetta continuum observations of polar night in the Southern regions,” by M. Choukroun et al, which is accepted for publication in Astronomy and Astrophysics.
Science results from MIRO and other instruments on Rosetta are being presented this week at the European Planetary Science Congress in Nantes, France.



Discussion: 25 comments
Claudia, your clickable link to the paper doesn’t appear to be working. Not for me, at least. Can be downloaded here, though: https://www.aanda.org/articles/aa/pdf/forth/aa26181-15.pdf
The two links to the paper appear malformed; neither one seems to work. Help!
Oh, I just found the paper here, in the “forthcoming” section of A&A’s website: https://www.aanda.org/component/article?access=doi&doi=10.1051/0004-6361/201526181
Hi Rick, apologies for the broken link, it is fixed now. Indeed, you can retrieve the article at https://dx.doi.org/10.1051/0004-6361/201526181
Best wishes
It’s interesting to compare and contrast these findings (assuming they hold up) with the findings made by the same instrument at the two asteroids, Lutetia and Steins, from earlier in Rosetta’s mission. Steins was a smallish (~ 5km) asteroid, and it’s rocky surface was easily resolved by MIRO. It showed a very high thermal inertia of ~ 650 J (K m^2 s^0.5). Ergo, typical of rock.
Lutetia is a much larger asteroid (~ 100 km), and has a very much lower thermal inertia of <20 J (K m^2 s^0.5). This fits with the surface being covered to some reasonable depth with a lunar type regolith, which Lutetia, and other large asteroids, are capable of retaining from micrometeorite impacts, due to their higher gravity.
So, if whatever is below the surface at the south pole of 67P is confirmed as being transparent to MIRO, then it most certainly isn't rock.
https://www.lpi.usra.edu/meetings/acm2012/pdf/6417.pdf
Very interesting the issue you are signaling, Ianw16. Significant South areas should be ‘clean’ material, actually. Really intrigued about forthcoming preliminary papers from the Teams. Relevant issues are going to be definitively settled 🙂
@Logan,
“Relevant issues are going to be definitively settled ”
Seems like it might have been!
https://agu.confex.com/agu/fm15/meetingapp.cgi/Paper/85998
“We see temperature variations due to diurnal and seasonal changes in insolation, and also see evidence for subsurface ice in some regions.”
This is only an abstract to a poster presentation, but the lack of words such as “possible” and “hypothesised” make it seem that they now have enough on the shape model to confirm it as ice. We shall no doubt see a paper in due course.
_That linear watercolor brushes… Could bet they say a lot about heat flow, and ultimately gas flow. Kind of radial -ized at neck’s South. High level of patterning.
This pair of thermal maps exhibits Coraline with porosity at the highest macro level.
Fractal-ism stands 🙂
https://blogs.esa.int/rosetta/files/2015/10/TemperatureMap_MIRO.jpg
Should be noted that several 20K brushes are followed by 80K brushes, at front side facets, at this global dual thermal map.
This 80K brushes are not due to nano-dust being quickly heated by Sun. This was dark South at the time.
Beyond the triangular facets being perceived at H. NAVCAM and OSIRIS. Another triangular facet, on the thermal map, just above Ducky’s neck.
“and no indication of differences between the three
regions (two lobes and neck) was found from a thermal properties perspective”.
On my mind that doesn’t quite fit well with ‘binary contact’ models.
On Emily’s sandwich:
“We hope that, by combining data from all these instruments, we will be able to confirm whether or not the south pole had a different composition and whether or not it is changing seasonally.”
https://blogs.esa.int/rosetta/2015/05/01/cometwatch-26-april/
67P look like a sandwich at this shot, maybe ‘Ducky’s face’ side, just that side, is our contact binary.
If so, we are talking about really big comets, as correspond to this very dusty object [fragment?].
Ducky being a ‘pariah’ of early post-Neptunians accretion?
Is a young Sun cold enough as to accept post-Neptunians class objects on the orbital energy class of 67P?
Frankly, quite a mess: Sun evolving, planets evolving, disk evolving, mother nebula evolving [and deriving], and sure missed lots and lots of other things.
Shouldn’t stare into this knowledge abyss.
A “Chip off the Old Block” then?
Plus, “Stretch”, ” Contact”, or “Erosion” at neck?
😉
Regolith from the third object. Sublimated water from the binary. Sinter quite a while. Add a fussed plaque at South bottom 🙂
You are not so lost, Ana 🙂
Very_ particular radar perspective of Toutatis, showing signs of “sandwich-ism”:
https://i2.cdn.turner.com/cnnnext/dam/assets/130207135906-toutatis-horizontal-large-gallery.jpg
A ‘chip’ of a gigantic accretion silicate object. Chips should be a lot more frequent than objects themselves.
https://www.sciencemag.org/content/early/2015/05/27/science.aaa4747.full
Why South side went excluded from terrace mapping?
Document was received on March24.
ERRATA: That’s reception date of:
“Dark side of comet 67P/Churyumov-Gerasimenko in Aug-Oct 2014”
Have no reception date of:
“The shape and structure of cometary nuclei as a result of low velocity accretion”
For the EU Crew:
Temperature maps from a few tens of cm below surface. Certainly including any active jet basins or nozzles or fissures, especially considering where we now know jets emanate and the radial nature of the dark red spots shown here.
So, EU proponents can look at the hottest spots here, which are a “blistering” 200 K, that is, minus 100 degrees Fahrenheit at maximum. Then we can try to find any relevant photos of jets from Sept. to October 2014 to correlate to the dark red spots, but why bother, unless the temperature map showed any truly hot spots at all?
Just saying, with this temperature map I think we are all looking at the “frozen smoke” of a “non combustible” gun.
I keep reading that we will eventually see a temperature reading of a jet that shows just how hot the jet source is any time now! But I think we are already looking at just that here, and the jets are only Antarctica-Winter-Cold… at best?
If wanting to keep alive the concept then the concept is needing a scale down, at least for 67P :/