This week’s CometWatch features an image obtained with Rosetta’s NAVCAM on 19 April 2016, 29.4 km from the nucleus of Comet 67P/Churyumov-Gerasimenko.
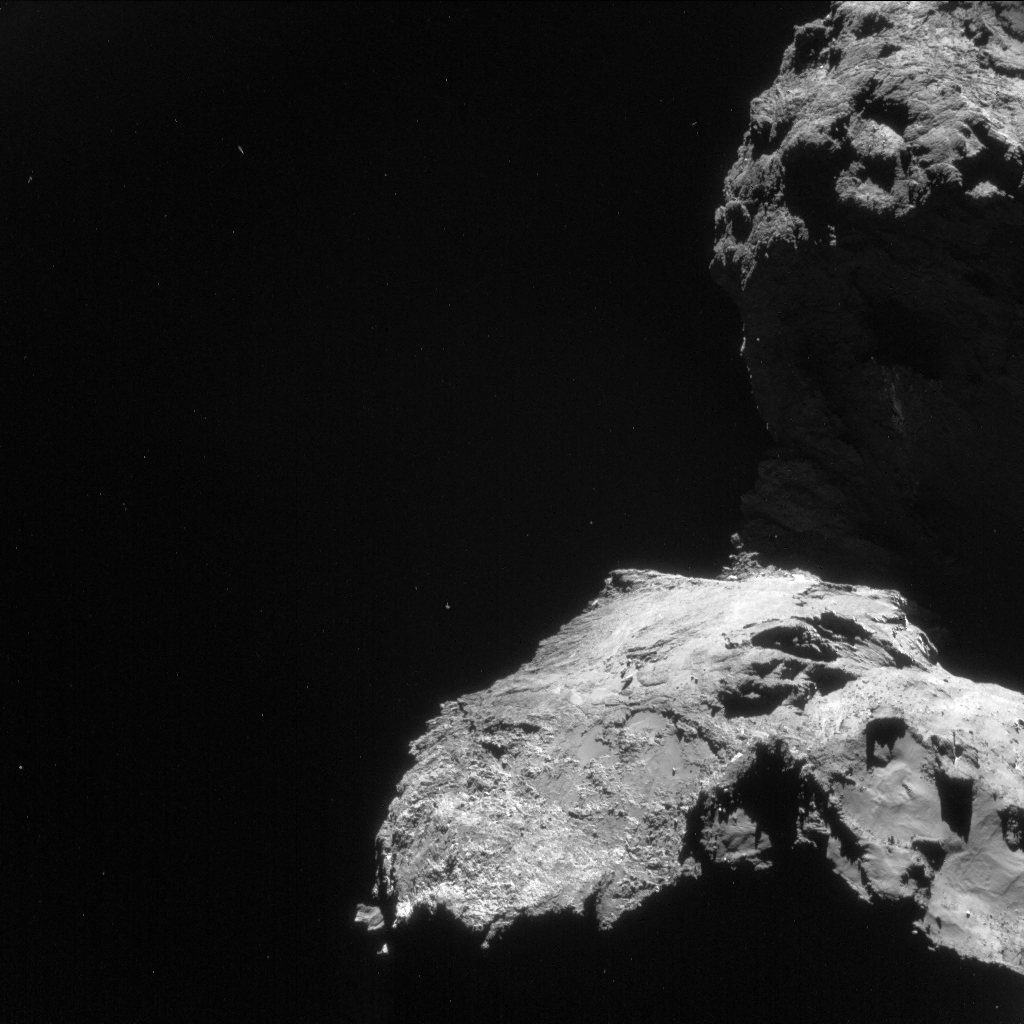
Enhanced NAVCAM image of Comet 67P/C-G taken on 19 April 2016, 29.4 km from the nucleus. The scale is 2.5 m/pixel and the image measures 2.6 km across. Credits: ESA/Rosetta/NAVCAM – CC BY-SA IGO 3.0
At these close distances, the comet nucleus overfills the field of view of the camera. In this view, which is not centred on the comet, only a portion of the nucleus is in sight, with the small comet lobe up and the large lobe down.
On the small lobe, which is casting shadows on the comet’s neck underneath, we can see the rugged terrains of the Bastet region.
On the large lobe, the view is dominated by a smooth portion of Aker, just below the neck in this view, which gradually declines towards the rougher Khepry. In the lower right corner, a part of the Babi region is visible, with hints of the elongated Aten cast in shadow.
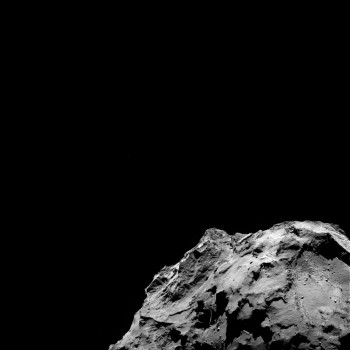
OSIRIS narrow-angle camera image taken on 13 April 2016, when Rosetta was 109.2 km from Comet 67P/C-G. The scale is 1.98 m/pixel. Credits: ESA/Rosetta/MPS for OSIRIS Team MPS/UPD/LAM/IAA/SSO/INTA/UPM/DASP/IDA
A portion of Babi is also featured, from a different viewpoint, in this recent image captured by Rosetta’s OSIRIS narrow-angle camera on 13 April (on the right). In this orientation, the small comet lobe is in the foreground, in the lower right corner of the image, with the large lobe on the left.
The view on the small lobe reveals the large circular depression of Hatmehit, covered in dust and boulders, with smooth portions of Ma’at to its left. On the large lobe, in the background, are the terrains of Babi, which degrade towards the smoother Ash region, visible in the lower left.
A different perspective is offered in another OSIRIS image (below), taken yesterday with the wide-angle camera from a distance of about 30 km.
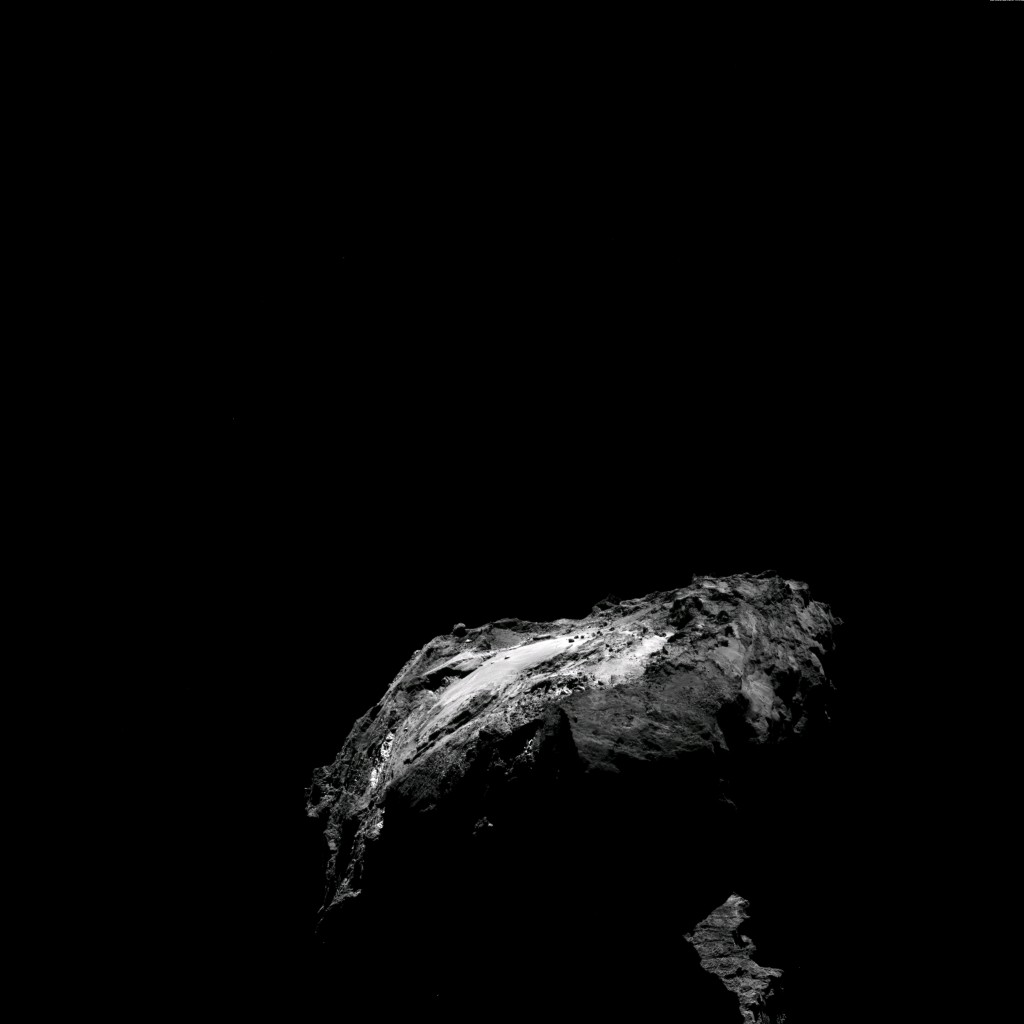
OSIRIS wide-angle camera image taken on 21 April 2016, when Rosetta was 30.8 km from Comet 67P/C-G. The scale is 2.96 m/pixel. Credits: ESA/Rosetta/MPS for OSIRIS Team MPS/UPD/LAM/IAA/SSO/INTA/UPM/DASP/IDA
In this view, the large comet lobe points up, with the flat landscape of Imhotep beautifully illuminated, revealing boulders, circular basins and other geological features of this region, and portions of Ash visible on the right. Part of the small lobe can also be seen in the lower right, with a hint of the Hathor region and its cliffs that scarp steeply towards the neck of the comet.
Meanwhile, 819 new NAVCAM images were released this week, covering the period between 10 February and 8 March 2016. You can browse through them via the NAVCAM Image Browser tool.
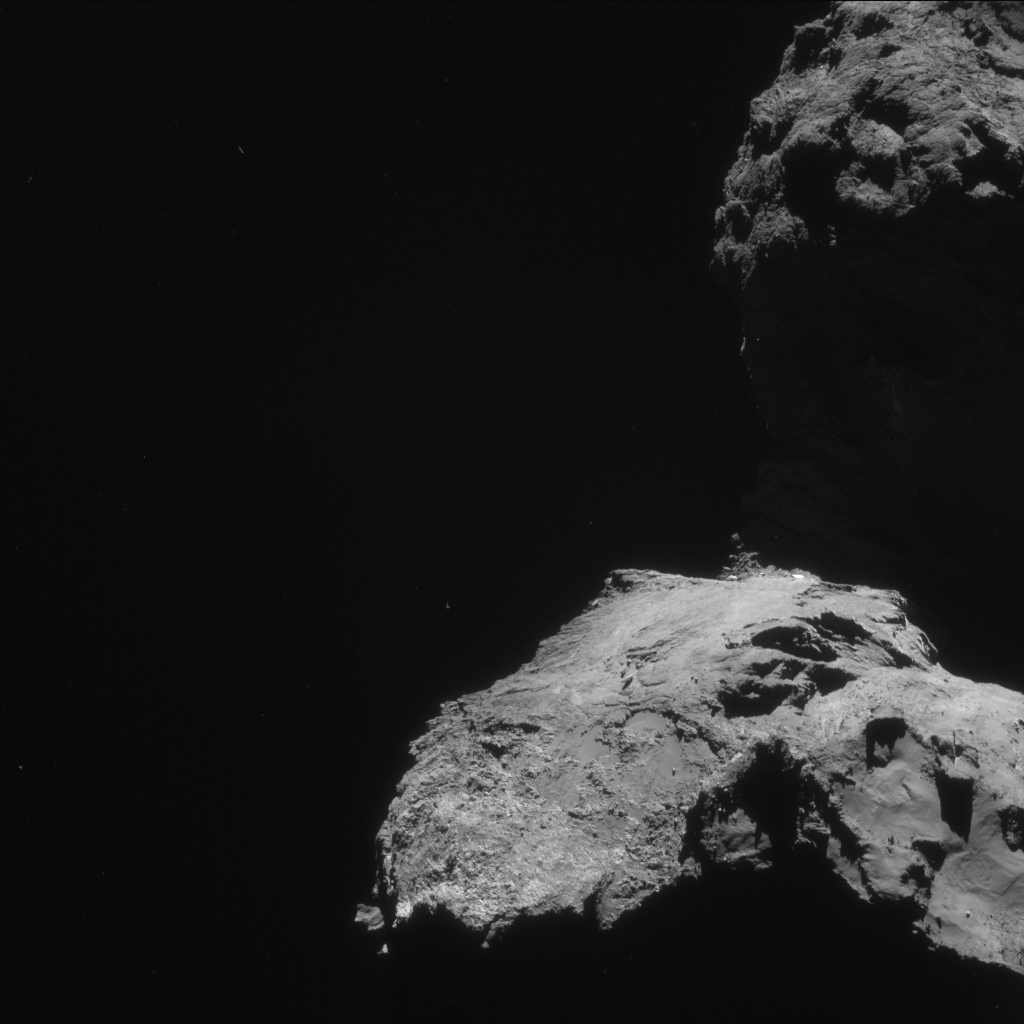
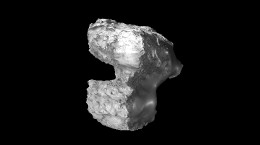
The original NAVCAM image is provided below.


Discussion: 14 comments
This comment refers to the second photo, which is the first OSIRIS photo of the two:
https://www.esa.int/spaceinimages/Images/2016/04/Comet_on_13_April_2016_OSIRIS_narrow-angle_camera
In this photo, there’s a feature resembling a mesa on the left hand sloping horizon. This has been photographed and commented on several times here in the past. In early 2015, a jet appeared in the scree just in front of its cliff that’s facing us. This wouldn’t be unexpected with stretch theory in mind. (To be clear, stretch isn’t accepted by the mainstream). According to stretch theory, this mesa slid nearly a kilometre from a particular identifiable seating point to its current position.
Just to the left of middle at the bottom of the frame there’s a bilobed shadow. The right hand lobe almost kisses the frame edge. There’s a sharp, brighter V-shape between the two lobes of the shadow.
The lobes are the shadow of the “gull wings” in the stretch blog that have been exhaustively matched to the head lobe. They’re about 180 metres long. They exhibit eight fiduciary matches to the decametre scale on a wing shape that’s identical on both body and head. In the photo, the actual gull wings are the bright, sharp-edged curve bordering their bilobed shadow. They have a small, dark, defined ridge just behind them.
The mesa on the horizon used to sit on the gull wings (according to stretch theory). Its slide was radial, away from the north pole and occurred when the crust delaminated from the layer beneath due to longitudinal stretch. It slid along the line of the well-defined ridge that runs from the gull wings to the mesa. That ridge was almost certainly formed by the slide itself.
The ‘cliffs’ below and to the right of the mesa in this view are slightly closer to us. They suffered the same sliding fate but because they have more bulk, they slid in such a way that their far ends are exactly in line with the mesa’s far end. Together, they and the aforementioned mesa form the straight line of the cliffs of Aten when viewed from the opposite direction. The reason that cliff line is so straight is that the sections slid to a radius from the north pole at which angular momentum was conserved after they were flung outwards by centrifugal force. There’s a ‘crack’ all along the bottom of the cliffs but that’s just the bottoms of the slid mesas. Their sudden halt, en masse, explains the spectacular depth of the Aten depression.
The larger chunk of cliff notionally represents two mesas because the two sections sat between the next two sets of delaminated gull wings. Their distinct nature and separate slide tracks are discernible on the unannotated version of the Part 40 header on the stretch blog. There’s a fourth mesa on the right that mirrors the first one in that it’s smaller and so slid further to take its place dutifully in line with the other three, peeping over Aten. You can’t see its top here, just its side cliff but on the other three you can just see the white mesa tops. All four slide tracks are visible in Part 40 and in many other photos.
This whole process is laid out between parts 38 and 41 with a careful build-up of evidence, based on careful observation of the comet on the decametre scale. Each observation leads ineluctably to the next one, betraying the mechanisms of gull wing delamination and then the 4-mesa slide. The mesas are dubbed ‘cuboids’ in the blog.
Capaccioni et al’s frost cycle video shows the exact area of the 4-mesa slide as being distinctly bluer than its surroundings, notwithstanding the neck for obvious reasons. That is, the ‘riven’ area of the slide itself is bluer and also the ‘bunched-up’ cliffs which are like shards of delaminated slate that’s bunched back up again. Even the first mesa’s longer, thinner slide track is picked out as blue. The mesa tops and neighbouring regions are either red or much less blue. The mesa tops are the original, undisturbed dusty surface that sat between the sets of gull wings.
The frost cycle is the first video in the link below. The area of the slide is at top-middle. Pause at hours 4,5 and 6 for the main effect (3 full hours of blue without turning red). The fourth mesa slide track stays blue for the full seven hours it’s in the sun. It never turns red which is quite remarkable- and it’s the actual slide track only, not just that general area (except of course for the neighbouring slide track in hours 4-6).
https://blogs.esa.int/rosetta/2015/09/29/an-update-on-comet-67pc-gs-water-ice-cycle/
A Cooper,
Impressive detective work, very clear, and adds confirmation of ice below the surface as well as nicely showing the movement of the crust.
regards
Dave
Good point regarding proof of ice below the surface. Although it’s assumed there’s ice at depth, this surface ice proves it because it was once under around 100 metres of crust (but that’s if the crust-sliding hypothesis is correct).
The supposed slid crust in my last comment, comprising the four mesas or cuboids, is also hypothesised to have torn from two specific layers on the head, according to stretch theory. This was outlined in the last paragraph of a Rosetta blog comment I made on the March 1st Cometwatch:
https://blogs.esa.int/rosetta/2016/03/04/cometwatch-1-march/#comment-599440
These two head layers are hypothesised to have slid ‘upwards’ to roughly the same extent as the mesas have slid ‘downwards’ when viewed in upright duck mode.
I mention the head layers only for completeness owing to their relationship with the slid mesas, according to stretch theory. However, it’s the most complicated slide match on the whole comet due to delaminating in one direction then sliding in another direction and bunching back up again. It smudges the match. There are plenty of other slides that are far easier to see and divine the mechanism from. Some are recent additions to the stretch blog.
Any comments about the paper linked that demonstrates the presence of crystalline ice and clathrates in comet 67P?
In Earth’s oceans, abundant methane.clathrates embedded in crystalline ice are produced by the microbial reduction of CO2. Why not on 67P? Is the isotopic evidence consistent with biogenic methane clathrates or is that data not available?
“Meanwhile, 819 new NAVCAM images were released this week, covering the period between 10 February and 8 March 2016.”.
Such a little snippet to signal the most important published planetary photo collection up to this day.
Thanking Claudia for keeping a tab on it, and to H. NAVCAM and H. ESAC Teams for their World Class Work.
‘Foam-iness’ is becoming a stronger argument to keeping those ‘Low Lands’ flows attached to surface, while flowing.
Bob forgot a lamp at:
pixel663,1009 of:
https://imagearchives.esac.esa.int/action.php?id=56912&part=e&download
ROS_CAM1_20160308T080320
2/3X_axis,bottomY_axis.
[Speculating water ice reflectivity].
At some photo shots get a taste of a ‘sugary’, shattering candy.
[Remembering now that Robin had commented the ‘candy’ look before]
Any sugars on the instruments readings?
Sugars would be LESS plausible is biochemistry.
‘Avalanche scars’ quite common…
Significantly ‘dusted off’ after this perihelion, aren’t you, Coraline?
As in a city, transit could go any direction, but bulk of it following streets and avenues. Same here with lattice(s). Basins’ and ‘low lands’ contents don’t care about this.
A few weeks forgetting the necessary warning: Pure speculation.