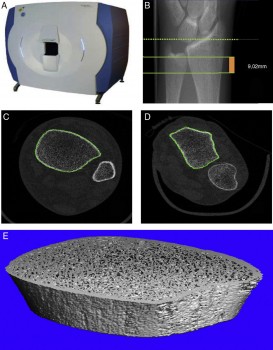
The dotted line indicates the reference plane, while the solid lines indicate initial and final planes of the test, comprising a thickness of 9.02 mm.
ESA astronaut Andreas Mogensen is back on Earth and his mission over, but his bones might still be feeling the (lack of) pressure. Laurence Vico from the University of St Etienne, France, explains the ‘Early detection of Osteoporosis in Space’ study:
Missions in space are impossible to reproduce on Earth for long periods of time. For us space is a unique place to study how the skeleton adapts to weightlessness whereas its evolution is caracterised by the fight against gravity on Earth. How our skeletons adapt to space is especially important for humans as we have two legs and rely on gravity to get around.
By looking at astronauts in space researchers can study people who basically do not use their skeleton, this type of research would require a test subject on Earth to be extremely inactive. Looking at astronauts in space we can determine the mechanisms of bone loss, some of which are similar to the mechanisms of osteoporosis.
Research has shown that the bones in the lower extremities are most affected by spaceflight. This research also helped technological advances such as high-resolution scanners that can assess the microscopic architecture of bones and their strength (Xtreme CT, Scanco Medical).
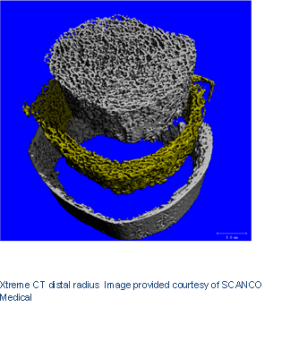 We are using these state-of-the-art scanners that ESA helped develop to measure astronauts’ before and after space missions and answer these questions:
- What are the kinetics of bone changes in space?
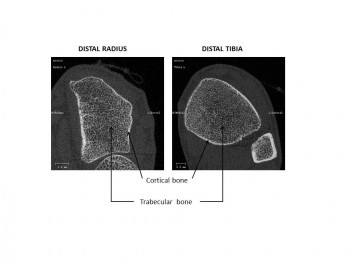
- How do non-weight-bearing bones such as the radius (wrist) change?
- How do weight-bearing bones such as the tibia (leg) change?
- How does bone mineral-density, bone geometry, structure and strength change?
- Do these specific bones recover after long-duration space missions?
- On a cellular level what is happening to bone activity during and after space missions?
A spaceflight of any length is helpful to answer these questions as we are looking to establish when and where exactly bone begins to deteriorate, when bone loss stabilises and when (or if) bones are able to recover.
To better understand the underlying mechanisms we measure the radius of the distal (near the wrist) and tibia bones using high-resolution tomography. We also analyse dynamic changes in bone turnover that we estimate by measuring bone biochemical markers representative of bone resorption and formation in the blood stream. We know that bone resorption activity is stimulated while bone formation activity is either diminished or unchanged, creating an unbalance in healthy bone renewal.
It is important to answer all these questions for astronaut medical concerns and to minimize risk of losing bone during and after spaceflight as well as to assess an astronaut before flight to prevent exposing him or her to a higher risk of fracture. Finally we hope to improve measures to counteract bone loss such as physical activity, changes in diet or even pills.
Experiment setup
We now have data for 13 astronauts who participated in six-month missions. We also measured three astronauts after a 10-day mission. Data are under analysis. Preliminary results indicate that after longer missions, there is significant bone loss at the tibia. Data from the 12-month follow-up indicates that the tibia cortical bone recovers, while the trabecular bone remains in its diminished state on landing. At the radius, cortical porosity increases and remains increased over 12-month post-flight. Even if other parameters are unaltered on returning to Earth, a progressive fragility develops that is significant even 12 months after landing. A parameter of bone strength called ‘ultimate load’ is still compromised in both places one year after return to our planet.
We measured Andreas twice in different positions on May 14, 2015 (four months before flight) to get baseline data, then on September 22, 10 days after landing.
Legend:
Tt BMD Total bone mineral density
Ct BMD Cortical bone mineral density
Tb BMD Trabecular bone mineral density
BV/TV Trab. Bone Volume to Tissue Volume
Tb.N Number of Trabeculae
Tb.Th Trabecular Thickness
Tb.Sp Trabecular Separation
C.Th Cortical Thickness
Ct Por Cortical porosity
Micro-Finite Element Analyses
The bone machine
Accurate quantification of bone microarchitecture is significant in understanding bone mechanics and response to disease or treatment. Central quantitative computed tomography (QCT) has the advantage of being able to image the two main osteoporotic fracture sites: the proximal femur and spine at resolutions of approximately 200–500 μm, but these resolutions are not high enough to examine the trabecular and cortical microstructure. While high-resolution peripheral quantitative computed tomography (HR-pQCT) is restricted to peripheral sites such as the distal radius and distal tibia, it produces images with an isotropic voxel size of 82 μm, allowing for the measurement of bone microstructure, density and estimated strength. To date, the majority of these HR-pQCT scanners still exist in research environments but their use has increased since their introduction in 2005.

Discussion: one comment
Where have the analysis of the results from the data measurements monitoring the 13 astronauts been reported?