Mark Bentley, Principal Investigator for MIDAS, describes the instrument’s calibration tests, which included taking a microscopic “selfie”!
Throughout the 957 day hibernation period of Rosetta, MIDAS has been in its “exposure” mode, with a clean target positioned at the funnel and the shutter open. Although the Solar System is full of dust, we didn’t expect to collect much, if anything; after all MIDAS has only a small opening to let dust in, and a small collector behind it. But we did it anyway. Firstly because, well, why not! But also as a safety measure – if the shutter were to jam after the cold of hibernation, at least we could still operate the instrument!
In our third re-commissioning slot, we performed our first real scan since hibernation. This lets us check out the newly upgrade flight software, do a real test of the instrument, and check if perhaps we did collect some dust during hibernation (the short answer is that we didn’t see any obvious dust grains in our first image, but we will run more scans in the coming weeks to check!). This test is partially non-interactive (the commands are stored on-board the spacecraft and sent to MIDAS at specific times) and partially interactive. In this latter part we tested upgrades to our feature recognition algorithm. Since operations onboard Rosetta have to be planned in advance, and an atomic force microscope is usually a “hands on” instrument, we have to bridge this gap with software. We do this by scheduling a scan and then letting the software examine the image and determine if there are any dust particles present. If so, the on-board software automatically sets up the microscope to look at the most prominent feature in a subsequent scan.
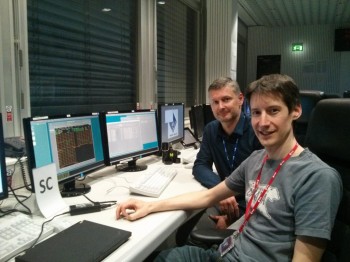
The way this works is that the image data is transmitted to Earth at the end of the non-interactive part of the exercise, along with the features in the image that the software has found. The MIDAS team sit at ESOC, the ESA control centre in Darmstadt, Germany, waiting for these data to be downloaded. We then look at the image and compare the features that we would choose to zoom in on with those that the software found. If necessary we update the coordinates for our zoom image (this is why we need the interactive part!) and upload these to MIDAS.
We also have to calibrate the instrument to make sure that measurements mean something in the real world. In the case of MIDAS we are measuring tiny dust grains, typically one micrometre in size – that’s one millionth of a metre, or one hundred times smaller than the width of a human hair! And the movements that the scanner makes for each pixel in an image are a hundred times smaller again, typically around 10 nanometres. To calibrate the instrument over such minute distances, we have to have appropriately sized calibration grids. And to make sure that our scanner (the unit that moves our sharp tips in three dimensions, X, Y and Z) measures a nanometre as a nanometre we carry three calibration targets. By periodically taking images of these targets we can be sure that all of our scientific images can be labelled with real units.
The first is a chequerboard pattern that lets us calibration distance in X and Y (that is left/right and up/down in an image). The second is a series of steps to calibrate height (Z) – remember that MIDAS makes 3D images! By scanning these and analysing the images we can convert the raw numbers that come back from the instrument into values in real units (typically micrometres). To make sure that our images will always be well calibrated, we scan these images regularly throughout the mission.
The third calibration target is something a bit different, and to explain it we first need to go into more detail about how MIDAS builds a picture. Basically it lets us take a “selfie” of our sensors, to check on their quality.
MIDAS makes images by moving a very sharp tip over the surface of a collect dust grain (the sample). In an ideal world this tip would be a perfectly sharp spike. It is of course not possible to make something so perfect, and in addition the tips get slowly worn down in use. The exact shape of the tip directly influences the quality of our images as can be seen in the figure below. By understanding the tip shape we can both see how quickly the tip is wearing down (and switch to a new one if necessary) and also use this shape to correct the image for some of the distortions it causes.
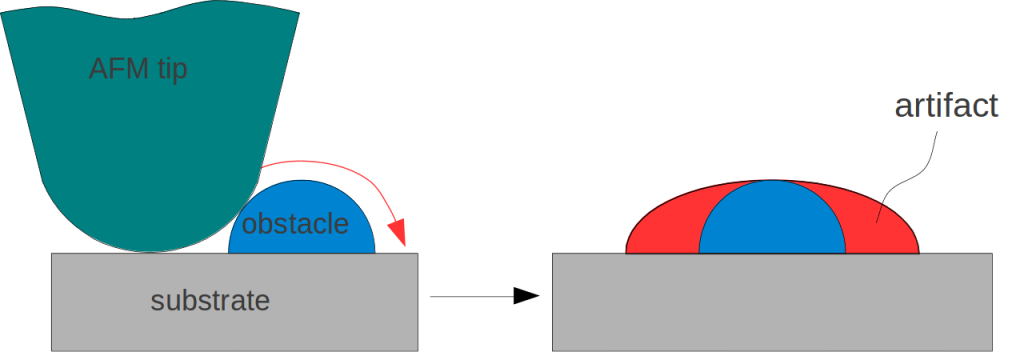
Diagram showing how the shape of the tips relates to the quality of the image produced. Image from Wikipedia https://en.wikipedia.org/wiki/File:Afm_artifact2.png
To measure the shape of the tip, MIDAS has a third calibration target, which is essentially a set of sharp spikes (even sharper than the sensor tips). By scanning these spikes we produce an image of the MIDAS tips themselves – a MIDAS selfie!
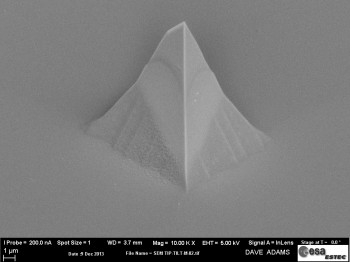
Here is an example of the results we get scanning a used tip on the Flight Spare, our ground-based copy of MIDAS (left), compared with a scanning electron microscope image of the same tip (right):
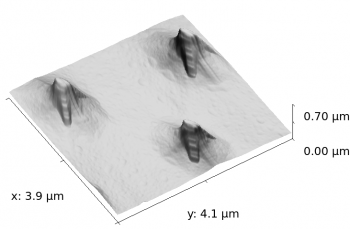
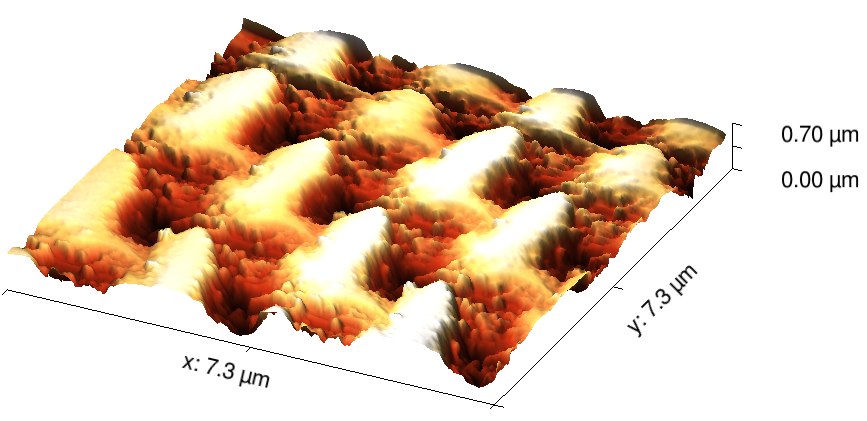
During the re-commissioning we decided to save our new, sharp tips for the real encounter with the comet, and to use a tip that we had used throughout the cruise phase over the last ten years. We expected it to be quite blunt, and this is what we saw:
The repeated structure comes from the fact that the calibration sample has a whole “forest” of spikes, and so we see the tip image repeated many times. This scan is lower resolution than the one above, but it is still easy to see that this tip is really blunt! This doesn’t mean that it isn’t useful, for example we can use it to simply find dust grains. But it means that we cannot obtain very high resolution images with it. But that’s why we built 16 tips for MIDAS. As soon as one is blunt, we simply move to the next one!
Images courtesy Mark Bentley.

Discussion: no comments