On 30 September 2016, at 11:19:37 UT in ESA’s mission control, Rosetta’s signal flat-lined, confirming that the spacecraft had completed its incredible mission on the surface of Comet 67P/Churyumov-Gerasimenko some 40 minutes earlier and 720 million km from Earth. Rosetta was working up to the very end, collecting reams of science data as it descended towards a region of pits in the Ma’at region on the comet’s ‘head’.
Before we ‘retire’ the blog, we wanted to catch up with the instrument teams following this grand finale to find out how their instruments performed and if there were any surprises in Rosetta’s last ‘words’ from the comet.
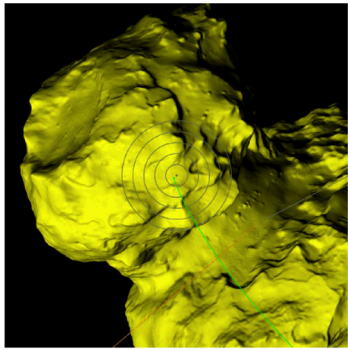
Rosetta touched down just 33 m away from the target point, as indicated by the green descent trajectory line. The inner circle has a radius of 100 m and the concentric circles around the centre are spaced by increments of 100 m. Credit: ESA
First a reminder of the impact site: Rosetta was targeting a point within a 700 x 500 m ellipse, between two pits in the Ma’at region. Reconstruction of the final descent trajectory showed that the spacecraft touched down at 10:39:34 UT at the comet, only 33 metres away from the target point and just inside a shallow, ancient pit. This accuracy once again highlights the excellent work done by the flight dynamics specialists who supported the entire mission.
The touchdown site was subsequently named Sais after a town in Egypt where the Rosetta Stone, for which the mission was named, is thought to have been originally located.
Right before impact, one of Rosetta’s star trackers generated an event reporting a ‘Large Object’ in the field of view: this was the local comet ‘horizon’. Upon touchdown, the signal coming from Rosetta was lost, and mission operators believe that this was most likely caused by the high gain antenna immediately off-pointing from Earth at impact. No further telemetry was received subsequently, indicating that the planned safe mode and subsequent shut down of the spacecraft likely occurred successfully.
Rosetta’s last image was taken with the OSIRIS wide-angle camera about 20 m above the surface. Prior to that, much of the imaging campaign during the descent focused on the 130 metre-wide pit named Deir el-Medina, as shown by the blue ‘footprints’ in the plot below. As seen on 30 September, the camera succeeded in capturing detailed images of the inside of the pit and its walls. These images will be used to help understand the comet’s subsurface and thus its geological history. The trail of orange and red squares then reflects the change in pointing of the spacecraft’s camera towards the impact site at Sais.
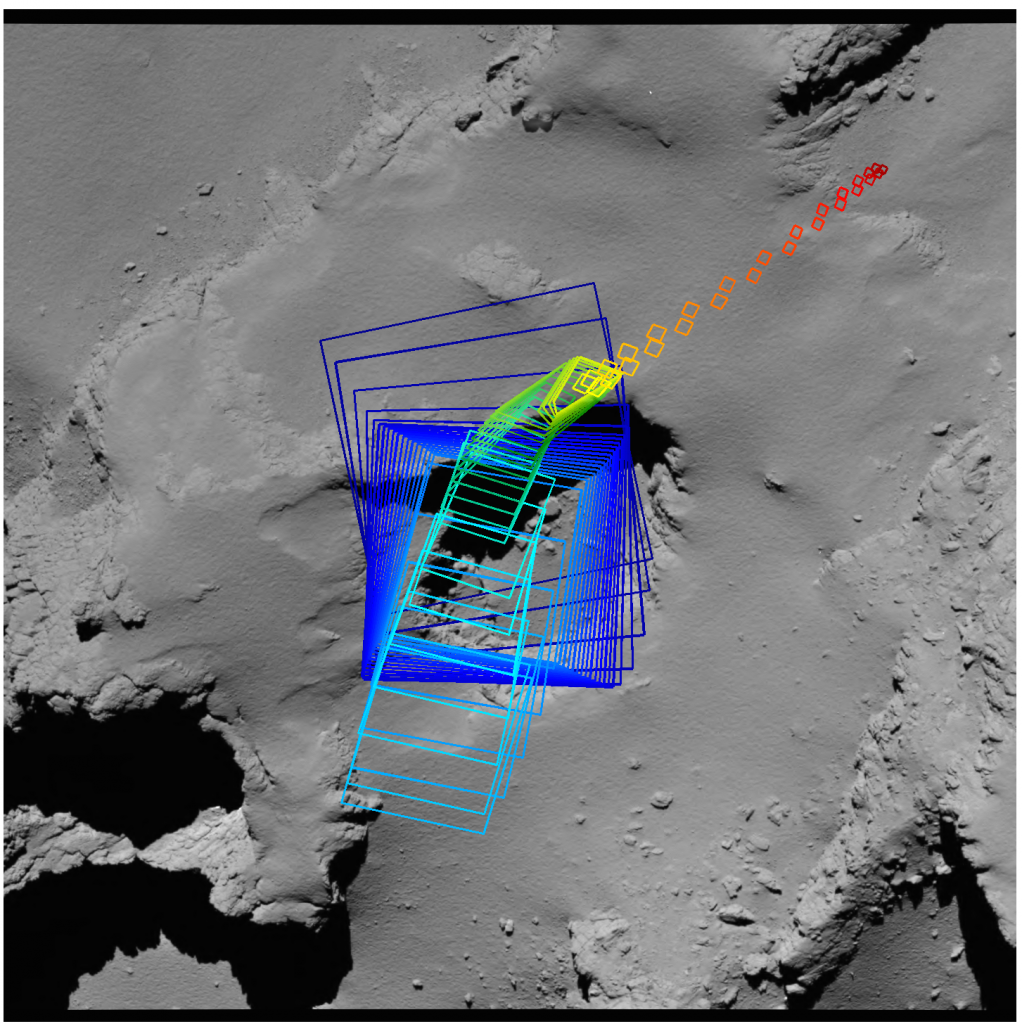
Imaging ‘footprints’ of the OSIRIS camera. The primary focus in the final descent phase was Deir el-Medina pit as shown by the blue squares, with the last images taken above the eventual impact site at Sais, as indicated by the red squares. Credits: ESA/Rosetta/MPS for OSIRIS Team MPS/UPD/LAM/IAA/SSO/INTA/UPM/DASP/IDA
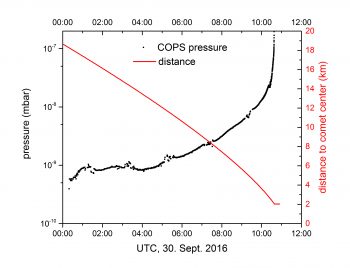
ROSINA’s Comet Pressure Sensor (COPS) measured the pressure of gas in the vicinity of the spacecraft during its final hours. The surface is at a distance of roughly 2 km from the centre of the comet. The small breaks in the black line are due to internal adjustments of the COPS instrument being made during the descent to cope with the rising pressure. Image courtesy K. Altwegg.
Pressure rising
Several other Rosetta science instruments were in operation during the descent, including ROSINA’s Double Focusing Mass Spectrometer (DFMS) and Comet Pressure Sensor (COPS). Both recorded data “down to the ground”, as ROSINA Principal Investigator Kathrin Altwegg puts it. As reported on the day itself, and shown now in the plot below, ROSINA measured an increase in the surrounding gas pressure by more than a factor of 100 as the spacecraft neared the surface.
“We saw the gas velocity and ram pressure drop to zero before we reached the ground, suggesting there is an interesting acceleration of gas slightly away from the nucleus,” says Kathrin. “We also collected good data with the DFMS, and will be looking at which kind of atoms and molecules were present in the gas.”
Temperature measurements below the surface
Mark Hofstadter, Principal Investigator for the MIRO instrument, reported that good data were collected throughout the descent, with the last measurement made at 10:39:07 UT at the comet on 30 September 2016. The MIRO team think the spacecraft was about 20 m above the surface at this point.
“For the last two minutes of data, our sub-millimetre beam footprint on the surface was less than 20 cm in diameter,” says Mark.
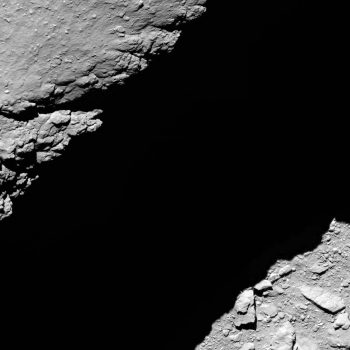
Comet 67P/C-G viewed with Rosetta’s OSIRIS NAC on 30 September 2016, 1.2 km from the surface. In the lower right corner is the bottom of the pit, while the dark band crossing the image diagonally from right to left is the shadow of the pit wall; the terrain above the pit is visible in the upper left corner. Credit: ESA/Rosetta/MPS for OSIRIS Team MPS/UPD/LAM/IAA/SSO/INTA/UPM/DASP/IDA
During the descent, MIRO collected continuum emission data from the nucleus, providing temperature measurements ~1 and 5 cm below the surface.
“Over the last few hours, we see temperatures varying between about 80 and 160 K as our beam moved across the nucleus. We think these differences are due to topography and shadowing – but we still need to correlate the details with topographic models and OSIRIS images to confirm that.”
“We also noticed that the temperature of our telescope rose over the last couple hours of the mission. We haven’t figured out yet if that is due to the angle of the Sun changing, or if we were being heated by the nucleus as it filled more and more of the sky.”
Mark also told us that MIRO’s last spectroscopic measurement of water in the coma was made in a limb-observing mode on 27 September at 13:26 UT. This resulted in a very rough estimate of the global average water production rate at that time of about 10^24 molecules per second or the equivalent of two tablespoons (this preliminary estimate may be refined following further analysis). During its most active period in August 2015, estimates were in the region of two bathtubs’ worth of water every second.
Comet chameleon
The Alice instrument also made observations at ultraviolet wavelengths all the way to the surface. The final spectrum transmitted was an exposure that started at 10:20:16 and ended at 10:30:21 UT at the comet, about nine minutes before impact. The Alice team estimates that the final data were collected over a range of about 1000 to 500 metres altitude above the surface, with each row on the Alice instrument covering an average spatial scale of about four metres.
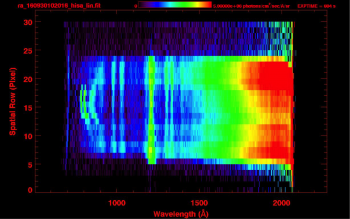
Final spectra from Alice, showing the reflectance of the surface at close range with ~3m resolution. Image courtesy A. Stern/J. Parker.
At the time of impact, Alice was 8.5 minutes into a 10-minute exposure. The last communication from Alice was a housekeeping packet received at 10:39:00 UT, about half a minute before impact. The housekeeping data included the count rate of the total ultraviolet flux over the Alice bandpass, which was being reported every 30 seconds, and which showed a steady increase in the UV flux during the descent.
Looking at the last hour of data from Alice as an overall averaged spectrum, the trend of the slope and lack of broad absorption features is very similar to previously published results. That is, Alice did not see significant differences in the surface composition at these high spatial resolutions when compared to observations over larger areas. There was also no obvious indication of small icy patches.
“Of course, these are very quick-look results that may change as we look more carefully at the data,” notes Joel Parker, Alice’s deputy Principal Investigator.
Data gathered from both Alice housekeeping and science telemetry indicated that the strength of a feature in the spectra nicknamed the ‘chameleon’ (the curved lines on the left side of the spectral image above) also increased throughout the descent.
“This feature has appeared throughout the mission with lots of variability, and we believe it is a result of dust and sometimes ions entering the instrument,” says Alan Stern, Alice’s Principal Investigator. “The morphology of the chameleon during this time period matches the morphologies seen during dusty time periods, indicating that there may have been an increase in nano-grain dust density as the altitude decreased.”
The last off-nucleus observation that Alice obtained of the comet’s coma was on 29 September, and was typical of limb spectra observed since the beginning of May 2016, when the comet was about 3 AU from the Sun. It showed that carbon dioxide outgassing was still on-going at the end of the mission, at greater distances from the Sun than seen when the comet was still approaching the Sun earlier in the mission.
“Overall, Alice worked exactly as planned throughout the end of mission and the descent, and provided an excellent dataset that will need much more detailed analysis,” adds Joel.
Steady solar wind and cometary plasma peak
The Rosetta Plasma Consortium sensors also enjoyed a good ride to the comet surface, with steady solar wind measurements.
“These data are actually very useful, providing us with a ‘quiet’ time reference profile covering a large altitude interval for a steady solar wind, which will help us calibrate the datasets that were took throughout the whole comet phase,” comments Hans Nilsson, Principal Investigator for the RPC-ICA sensor.
RPC-LAP and RPC-MIP both reported very low plasma densities through the descent, though slowly and evenly increasing, similar to that seen by ROSINA-COPS for neutral gas. However, the plasma reached a broad peak of up to about 100–150 cm^-3 (preliminary measurement) at about 2 km from surface, before dropping off again. This is as expected for a plasma originating from the neutral gas released by the comet: its density must be low at the surface since the molecules found there have just left the nucleus and have not had any time to become ionised.
“There is some plasma structure to be seen, but not much: this counts among the weakest ionospheres we have seen at the comet, but as may be expected in the northern hemisphere, which was winter at the time,” adds Anders Eriksson, Principal Investigator of the RPC-LAP sensor. “If there was any local outgassing from the Ma’at pits, it is at least not immediately striking in our data.”
RPC-IES demonstrated that the ions in the coma showed a modest increase in energy while the total flux of electrons decreased very near the comet, as expected and in line with the reduced coma density observations. The increase in observed coma ion energy could have been caused by an increase in negative spacecraft potential as the density decreased – something that is being looked into.
Finally, RPC-MAG made measurements down to a distance of about 11 m above the surface, showing no increase in the magnetic field with proximity. This confirms the finding, made during Philae’s landing in November 2014, that the comet is non-magnetic.
A dust free descent?
Of Rosetta’s three dust instruments, only GIADA was on during the descent, with MIDAS and COSIMA completing their missions in the days before. As it turns out, GIADA did not detect any dust, but this non-detection is itself an interesting observation.
“During the final descent, the environment was like a clean room!” remarked GIADA Principal Investigator, Alessandra Rotundi.
ROSINA, MIRO, and Alice team members confirmed the GIADA view. For example, the water production rate observed by MIRO over the region where Rosetta impacted was likely far too low to lift dust particles detectable by GIADA off the surface. Any dust grains present must have been very small indeed to evade detection, below GIADA’s limit of 50 micrometres diameter.
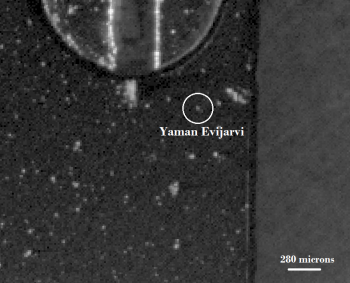
The very last COSIMA particle – named Yaman Evijarvi – was collected on 27 September 2016 between 01:51:55 and 14:08:11 UT on target 2C3, about 20 km away from the comet. Image courtesy M. Hilchenbach.
One last dust particle…
Even though COSIMA was off during the final descent, the instrument’s Principal Investigator, Martin Hilchenbach, told us that one last dust particle was collected during their final day of operations, on 27 September. At that time, Rosetta was about 20 km from the comet centre.
The particle has the name ‘Yaman Evijarvi’. Earlier in the mission, COSIMA particles were named for COSIMA team members, but with thousands of particles collected, this list was soon exhausted. Instead, ‘Yaman’ was the next name on a random list of international names (this one from Turkey), and ‘Evijarvi’, the name of a Finnish lake, comes from the theme used by the team to identify time periods of dust collection.
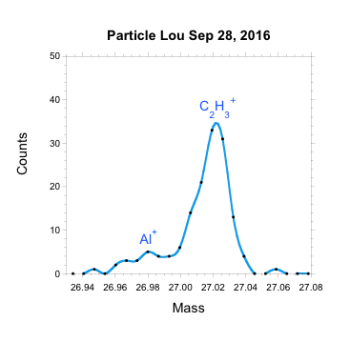
The last secondary ion mass analysis, around dust particle ‘Lou’ on target C3, zoomed to a mass range including aluminium and organic molecules. Image courtesy M. Hilchenbach.
Martin commented that the last days of Rosetta were as busy as ever for their team, as the COSIMA primary ion source parameters had to be adjusted in the very last minutes to acquire the last secondary ion spectra. “I was really impressed that after 26 months of operations, the motivation was just as high as on the first day,” he said. “In the end, our primary ion beam source outlived the total predicted hours of operation by a factor of two.”
Martin adds “And as planned, we returned all of the dust particles we collected back to the surface of the comet on 30 September – cosmic recycling, over 700 million km from Earth!”
“It’s great to have these first insights from Rosetta’s last set of data,” says Matt Taylor, ESA’s Rosetta project scientist. “Operations have been completed for over two months now, and the instrument teams are very much focused on analysing their huge datasets collected during Rosetta’s two-plus years at the comet.
“Data from this period will eventually be made available in our archives in the same way as all Rosetta data.”
And finally… from the blog editors to the Rosetta teams all around the world: thank you for sharing your stories and discoveries with us, to make this blog such a rich source of information for everyone to enjoy. We’re looking forward to the discoveries to come and continuing our science coverage on esa.int and sci.esa.int.



Discussion: 9 comments
“During the final descent, the environment was like a clean room!”
Speculating near environment already ‘dusted’ off by electrostatic forces.
Thanks a lot Alesandra and GIADA people
🙂
So, those global “waves” at Small Lobe could be Aerodynamically returned material, when aerodynamics relevant -at perihelion. And micro-dust ponds at ‘electrically grounded’ points on the surface. Just one scenario.
Should insist that my main model for such ‘leveled’ ponds is still ‘sneaking’, ultra-cooled nightly depositing gases. Floating dust acting as the ‘seed’. Slowly gaining ‘weight’, up to a mass/surface/charge point where it ‘snow down’. That phenomena could happen slightly above surface, at surface, or just below it. Has elements of 2 years of conversations here.
Clarifying, no ‘fluffy’ ponds. Surface is the product of the ‘meteorology’ of his exosphere.
Leveling can’t be explaining without ultra-cooled gases.
Entry quotes “Data from this period will eventually be made available in our archives in the same way as all Rosetta data.”
When is the next OVERDUE swathe of OSIRIS images likely to be published to the archive image browser?
How on Earth is an armchair scientist supposed to find MORE changes in the nucleus than those obvious from NAVCAM images?
Get it together – it just needs a nod from the ESA and a click of some buttons from the OSIRIS team……
Hi Marco,
Their currency is publishing science results first. Funding depends on it. The latest I’ve heard is that they are going to analyse each of the images in very detail on pixel level.
But I’ve no new information about the image release schedule.
NASA planetary missions usually publish the raw data with a delay of about 6 months, in some cases almost immediately after downlink.
The contract between OSIRIS and ESA may be different.
Might be, it’s worth to look into ESA’s PSA or NASA’s PDS from time to time, in order to see, whether other instruments publish their data first. Digging into those data may turn out to be interesting, too.
Start here:
https://sbn.pds.nasa.gov/data_sb/target_comets.shtml
scroll down to
67P/Churyumov-Gerasimenko 1
Begin at the end of the list and work upward.
The latest published OSIRS data seem to be of mission phase M13, until 2015-03:
https://sbn.pds.nasa.gov/holdings/ro-c-osiwac-2-esc1-67pchuryumov-m13-v1.0/data/2015_03/
Björn Jónson’s img2png may help to work with IMG files:
https://bjj.mmedia.is/utils/img2png/
Since the blog will be closed for new comments soon, it’s time to say good-bye, and best wishes. Keep on exploring!
Hi Emily
As you know, I think Ma’at 03 delaminated from Ma’at 02. I think it’s only a matter of time before this is accepted. With this in mind I’ve done a short post showing the number of small, red frames in Ma’at 03 that were captured at their seating by the blue frames in Ma’at 02. I think this is very important since the team has close-up data of both areas.
https://scute1133site.wordpress.com/rosetta-maat-03-landing-site-03-site-matched-to-02-seating/
(Logan- are you going to do a ‘reflections’ post? You are my favourite commenter, you know).
I’ve been wondering: Where is Rosetta? It wasn’t a lander, did it bounce around for a couple of hours, as Philae did? Is there any way to know for sure?
Probably yes. Nobody can know for sure.
Very exciting blog. Thanks to all for make this possible.