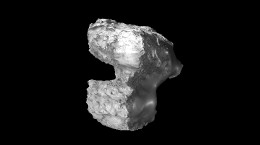
After a far excursion to explore the tail of Comet 67P/Churyumov-Gerasimenko, Rosetta is now back to closer distances from the comet nucleus. This week’s CometWatch image was obtained with Rosetta’s NAVCAM at 01:39 UTC on 10 April 2016, 31.4 km away.
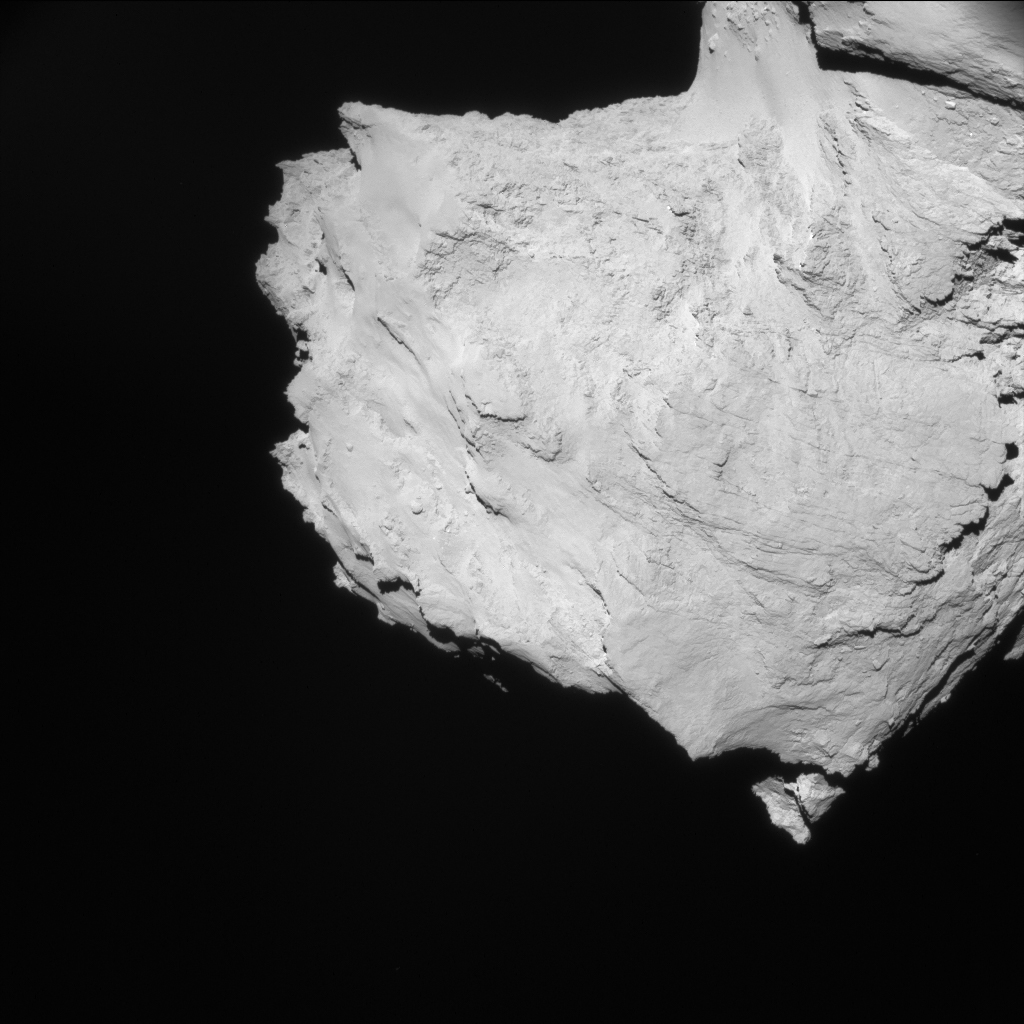
Enhanced NAVCAM image of Comet 67P/C-G taken on 10 April 2016, 31.4 km from the comet nucleus. The scale is 2.7 m/pixel and the image measures 2.7 km across. Credits: ESA/Rosetta/NAVCAM – CC BY-SA IGO 3.0
On the night between 9 and 10 April 2016, the spacecraft performed a special flyby, 30 km from the nucleus and with a phase angle very close to zero degrees.
The phase angle is measured between the direction of the sunlight illuminating the nucleus and that of the light reflected by the nucleus and caught by Rosetta. A near-zero phase angle means that these two directions are very close to one another, which happens when the spacecraft is flying exactly between the Sun and the comet.
In this configuration, Rosetta could see the sunlight hitting the nucleus at right angles, and therefore observed very little shadows on the surface.
The CometWatch image was taken shortly after the closest approach on this flyby, at a phase angle of 11.7 degrees.
The image shows mostly the small comet lobe and ‘neck’ region, with the smooth and bouldered terrains of Hapi, along the comet’s neck, visible in the top right corner. A hint of the large lobe can also be seen in the top right corner.
Moving towards the lower left, portions of the rough Hathor region are visible, as well as parts of Ma’at farther on the left. The linear and almost parallel features visible on the right, instead, are part of Bastet.
The three-dimensional aspect of the nucleus and of its characteristic surface features is almost lost in this low phase-angle view, due to the scarcity of shadows. This is even more evident in the image captured by Rosetta’s OSIRIS wide-angle camera at 00:57 UTC on 10 April, about one hour before the NAVCAM view, at a phase angle of 0.9 degrees.
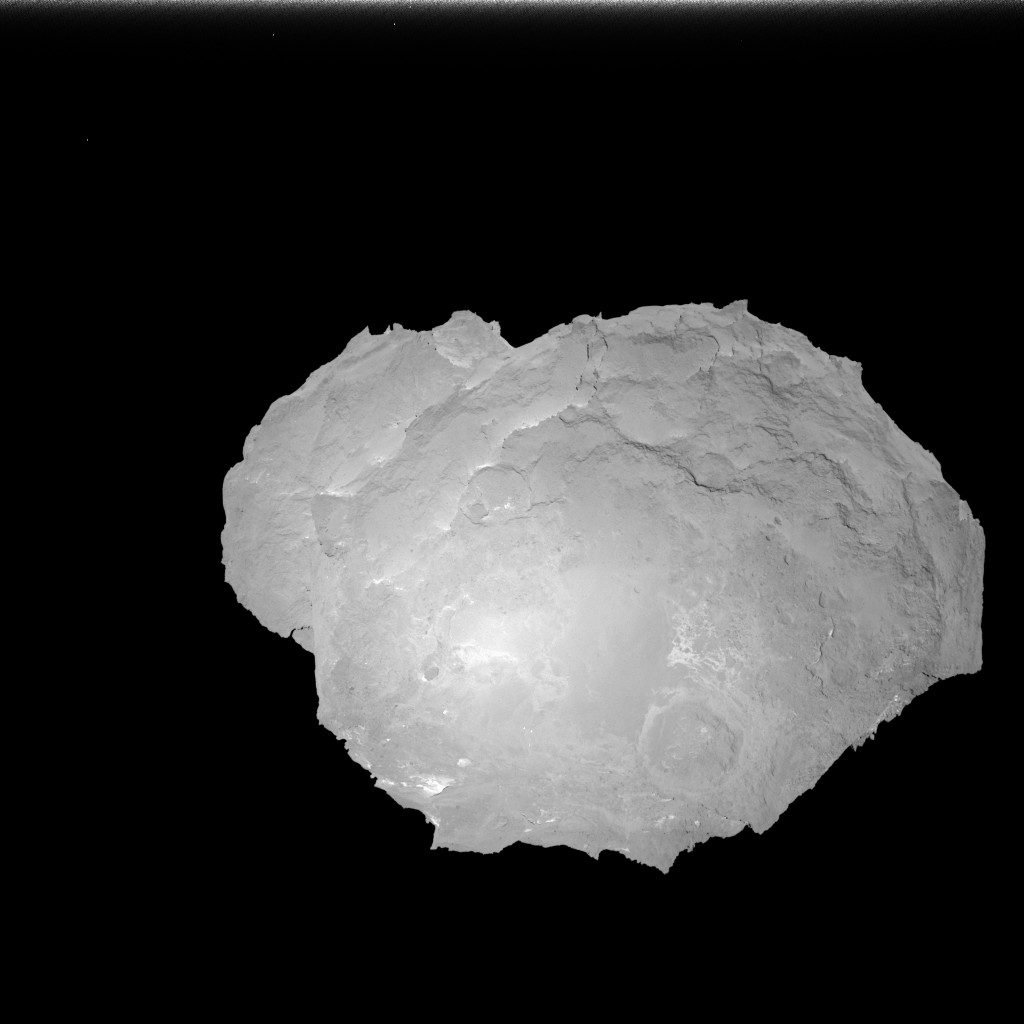
OSIRIS wide-angle camera image taken on 10 April 2016, when Rosetta was 29.3 km from Comet 67P/Churyumov–Gerasimenko. The scale is 2.86 m/pixel. Credits: ESA/Rosetta/MPS for OSIRIS Team MPS/UPD/LAM/IAA/SSO/INTA/UPM/DASP/IDA
In this image, the large lobe is in the foreground and the small lobe in the background, on the left. The view on the large lobe is dominated by the flat landscape of the Imhotep region, with Khepry on its lower left, Aten on the upper left and Ash on the upper right.
Parts of Imhotep, Khepry and Ash are also featured in this OSIRIS narrow-angle camera image, taken somewhat earlier, at 00:10 UTC on 10 April, at a phase angle of two degrees.
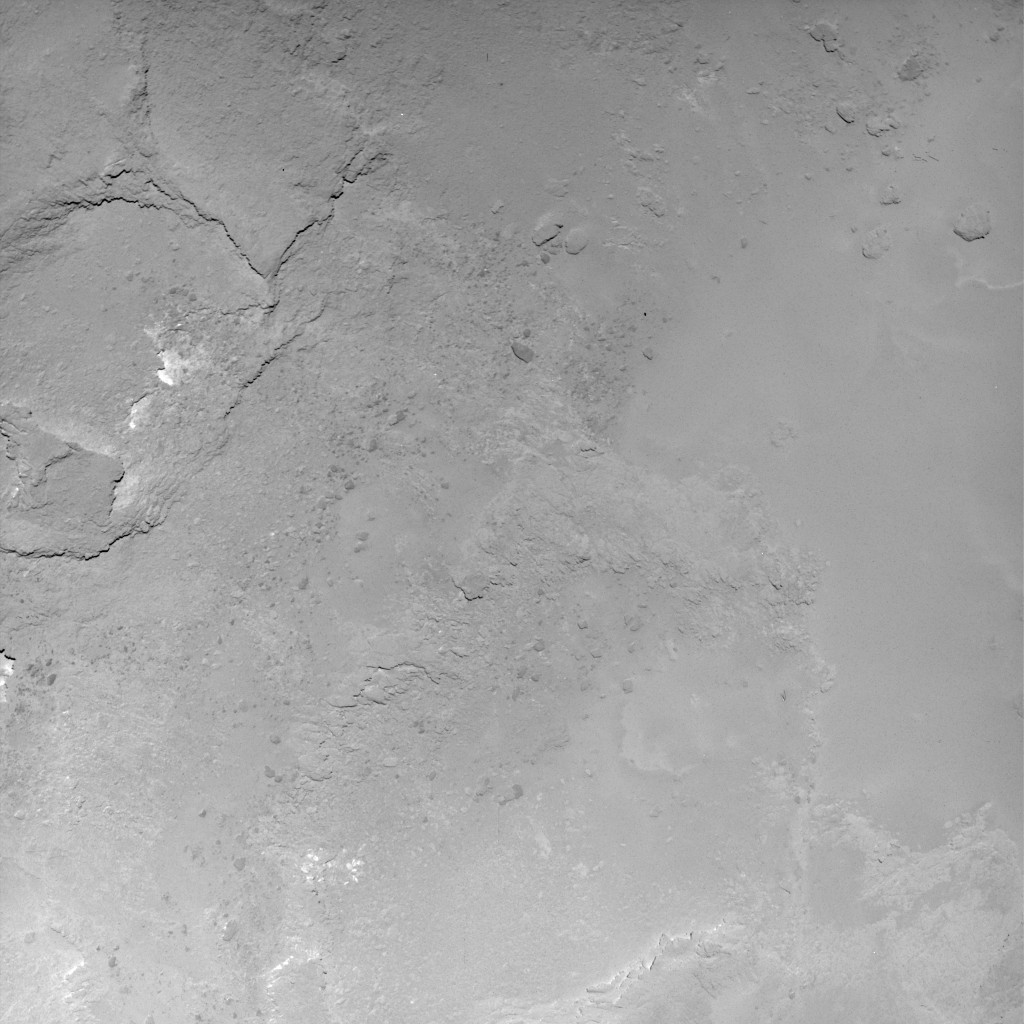
OSIRIS narrow-angle camera image taken on 10 April 2016, when Rosetta was 30.1 km from Comet 67P/Churyumov–Gerasimenko. The scale is 0.55 m/pixel. Credits: ESA/Rosetta/MPS for OSIRIS Team MPS/UPD/LAM/IAA/SSO/INTA/UPM/DASP/IDA
With hardly any shadows cast on the surface, the morphological differences between the three regions do not markedly appear. However, we can still recognise the smooth terrains of Imhotep in the right half of the image, while the cliff in the upper left corner is part of Ash and the rougher areas at the centre and towards the lower left belong to Khepry.
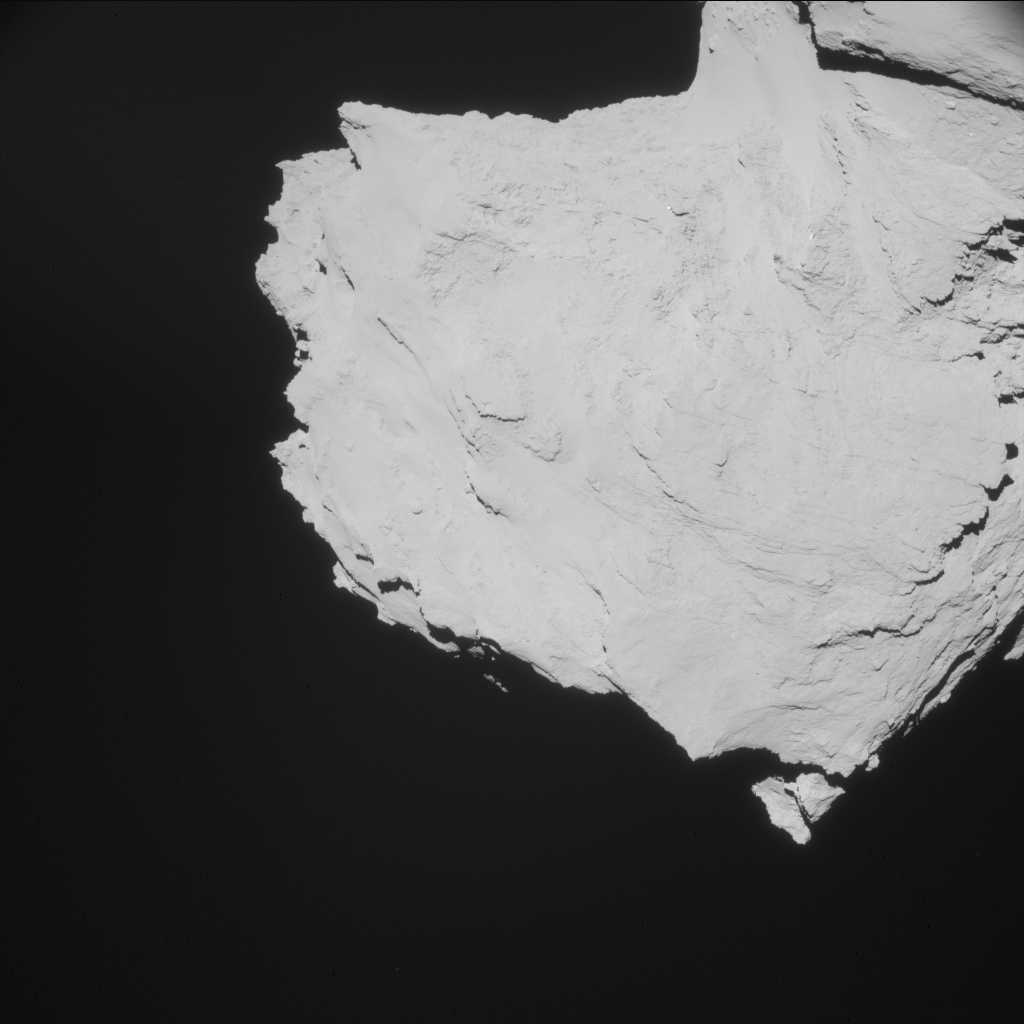
The original NAVCAM image is provided below.

Discussion: 18 comments
The pictures are a pleasure as always
Was there a particular scientific objective to the very low phase angle observations?
I can see an argument for collecting this special case ‘just in case’ it reveals something special.
But wondered if there was a specific rationale.
This special case has already found something special. There are numerous light or dark shapes that are the same and which correspond to features already matched in Part 42 of the stretch blog. These were found solely by rewinding the stretch movie and without knowing anything about their reflectivity. So both this zero phase picture and Filacchione et al’s red/blue spectral slope figures corroborate matches found by completely different means i.e. by following tensile force vectors due to spin-up whilst remaining blind to all other considerations.
Moreover, on the close-up OSIRIS photo, I zoomed into what must be the most boring, bland, grey 40 x 40- metre square in the picture knowing that this exact spot should match to a more obvious feature 400 yards away. It showed five mini matches to the feature within that small area. The surrounding areas don’t show any paraedolic matches however hard I try to see them. You would never notice this match or know where to look for it if not conversant with stretch theory. I knew where to look because we now know what tore from where, how far it slid, in what direction it slid and why it tore and slid in the first place. And that’s the case for multiple cases over the whole of Imhotep. Stretch theory is now predictive from the hectometre down to the decametre scale.
All these finds will be laid out eventually and the Part 43 overview will be expanded on in minute detail over five or more parts.
IanW: I tried recognizing the features shown in Cometwatch 19 March on the zero-shadow images above. It is really difficult. So in order to achieve your goal one has to compare one zero-shadow image with another taken earlier. We know there were some during the Feb 14 flyby but that was a slightly different flight path. Hopefully the comparison will yield results.
@Harvey,
The thing that sprung to my mind, is that there was an outburst in the Imhotep/ Khepry region, back on 22 August:
https://blogs.esa.int/rosetta/2015/08/28/cometwatch-22-august-2/
If one were looking for evidence of any changes, then perhaps this is the best way of seeing the whole area without missing areas due to shadowing.
Probably way off beam, but you never know.
IanW: Sorry, my reply went above rather than here.
Kamal
Kamal
The middle picture in Cometwatch 19th March is mirror-flipped. That may be the reason you found it quite hard to see similarities. Even when constantly bearing this in mind and flipping it in your mind’s eye, it’s quite difficult to see the relevant features though not impossible. I mentioned the mirror-flip and the OSIRIS metadata in the comments on that thread.
I agree that discerning features from different angles and under different phase lighting is difficult let alone perceiving any changes in those features over time. Many features appear to change shape and even orientation with each other in different views. It’s only when you take it further and look from all angles that you can build up a 3D picture of the feature and see that it is its vertical relief and/or shadowing that’s causing the illusion. Using the shape model for this is a no go. It’s smoothed and irons out the bumps and dips on the metre to (low) decametre scale.
Dear Harvey,
This and the Feb 2014 flyby were specifically designed for studying the surface properties of the cometary nucleus at a wide range of phase angles, including a passage through the sub-solar point.
In order to thoroughly analyse the phase function for comets (i.e. how radiation is reflected at different incident viewing angles), the remote sensing instruments need to acquire data at zero-degree phase and additional data with phase angles between 0 and 45 degrees.
These data will be used to conduct studies of bidirectional reflectance of surface materials and will be used to compare with laboratory data acquired at low phase angles. The spacecraft has spent the majority of the mission at high phase angle, so these observations are very valuable. Having one before and one after perihelion allows the scientists to examine the evolution of these properties, too.
@Claudia,
Thanks for that. I knew I’d be wrong!
Claudia. Many thanks. That’s broadly as I was guessing, but I hadn’t thought of it as providing BRDF data. Thank you.
Good to see different angles of lighting.
Where is the shadow of Rosetta? If phase is basically 0 it ought to be seen on the surface of 67P/CG and reveal from scatter even more about dust/coma in sun direction.
What was the purpose of that low angle flyby ?
Thanks
Dear Carsten,
See the reply to Harvey asking a similar question (above).
Best wishes
Very interesting to conduct this interesting fly-by resulting in such different pictures. Having a (near) 0 phase angle, there should be a picture where the shadow of Rosetta is seen on the surface of 67P/CG – might give some extra science. Any such pictures to share? or run a second try closer by, so this is possible to see?
@HL,
The shadow of the spacecraft was seen back in Feb 2015, as shown here:
https://blogs.esa.int/rosetta/2015/03/03/comet-flyby-osiris-catches-glimpse-of-rosettas-shadow/
That image was taken from 6 km altitude. Just doing a bit of trig, based on a 2 degree angle for the OSIRIS image in this post, at 30km altitude, shows that the centre of the shadow (if noticeable), would have been ~ 1 km away from the centre of the image, towards the bottom. The image is 2048 x 2048 pixels, at 0.55m per pixel. So the bottom of the image is 1024 x 0.55m = ~560m distance.
I suspect it would be very ‘fuzzy’, if noticeable at all, even at 0 phase angle, at this altitude.
The images have never ceased being a pleasure, that’s for sure Terran. I’ll forever be thrilled by what has come out of this mission, and forever grateful for the people who worked so hard to make this all come true and onto our screens. Amazing.
Yes! It’s hard to remember’ looking at these almost glowing low phase angle views, that the nucleus is as black as coal.
By the way, why is it apparently impossible to post a visualization of the trajectory of Rosetta relative to the comet?