In the week that we celebrate a year that Rosetta has been at Comet 67P/Churyumov-Gerasimenko and mark their passage through perihelion, we are delighted to present a new interactive tool that allows you to explore the shape and surface of this intriguing comet.
View Rosetta’s comet is based on images taken with Rosetta’s navigation camera, NAVCAM. Since November 2014, these images have been released under a Creative Commons license, which allows you to share them with whomever you like, to publish them on your blog or elsewhere, as well as to adapt, process, and modify them.
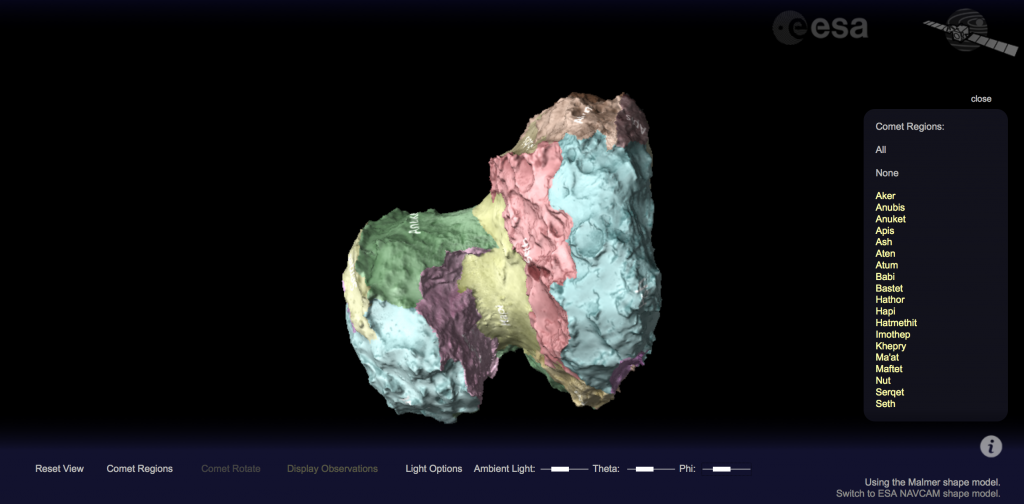
Screen shot from the View Rosetta’s comet interactive tool.
As of 30 July this year, more than 6800 NAVCAM images are available to download from ESA’s Archive Image Browser, and that number will increase with the regular addition of many more as Rosetta’s mission continues.
From reactions that we’ve had on this blog, via social media, and meeting people at events we know that many of you are intrigued and fascinated by Comet 67P/C-G — as we are.
As far back as August last year, when the unusual shape of this comet became clear, we saw the need for an interactive way of exploring the surface of the comet. More recently, we started to wonder about what could be done with the Rosetta images and 3D computer models of the shape of the comet.
A conversation that started on a Friday evening as a “Wouldn’t it be great if we had an interactive way to view the comet?” set our colleague Oliver Jennrich thinking, and by the following Monday morning he had come up with a simple prototype tool using a shape model that had been developed by Mattias Malmer an image processing expert and space enthusiast living in Sweden. Mattias used publicly available NAVCAM images to generate his model and then made it available via his own website.
With this basic tool, it was possible to zoom in and out, and rotate and pan across the comet. This was already better than anything we had in the Rosetta communications team, but as soon as we starting playing with it more ideas started to flow.
Could we add the geological regions that have been identified on the comet’s surface? Could we tie this tool in with the huge repository of NAVCAM images in the Archive Image Browser? Could we include other shape models?
Over the next few weeks, Oliver implemented a number of new features, including a texture map made by Mattias to add the regions identified by Nicolas Thomas and colleagues in their scientific analysis of 67P/C-G.
Then Oliver added a trail of points along Rosetta’s trajectory to show where images of the comet have been taken by NAVCAM. That made it possible to link the tool to the NAVCAM database, to view and allow downloads of the corresponding images.
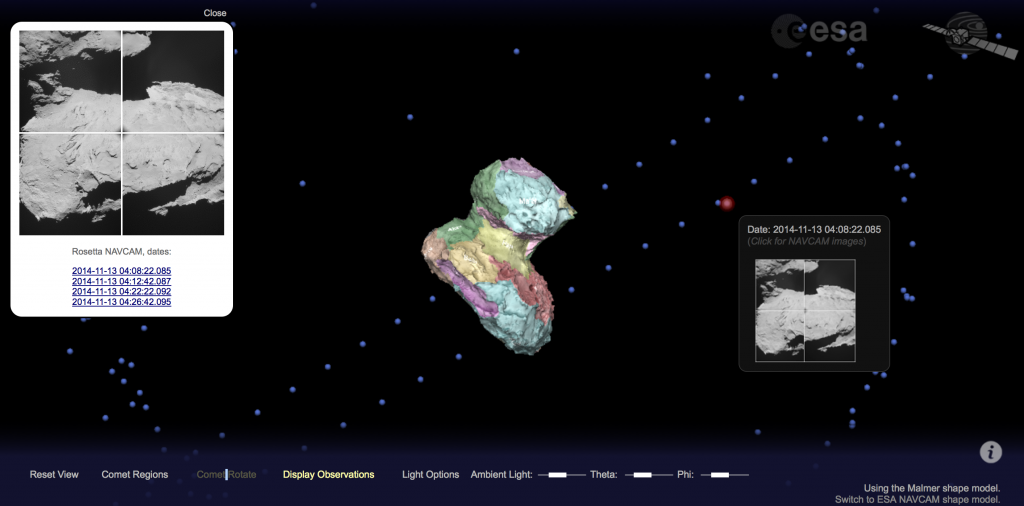
View Rosetta’s comet interactive tool provides access to some of the best NAVCAM images in the ESA Archive Image Browser.
With subsequent support from João Martinho Moura and colleagues at Science Office, who also worked on our Where is Rosetta? tool, the code was optimised and the interface fine-tuned. Most recently, a separate ESA NAVCAM shape model, developed by the ESA Flight Dynamics team, was made available for release and has been added to the tool as an option.
You can find more detailed information about the tool here. (Note that the viewer does require a WebGL-enabled browser and graphics card.)
But this is just the beginning! It’s clear to us that there is a lot of scope to develop the tool further, but we want to make this ‘beta’ version available to you now, at the time of perihelion, to enjoy and try out.
We aim to make further releases ourselves, but the code is available as open source, so feel free to take it and develop it further — we hope you do!
Share with us your comments about your experience, including your possible enhancements of the viewer, or new ways that you have found to use the images and shape models, via the comments block below.
Stay tuned for more NAVCAM images and updates to this tool.
And don’t forget to join us later today, at 15:00 CEST, for a Google Hangout with Rosetta mission experts as we celebrate perihelion.

Discussion: 7 comments
This is so awesome — thank you for sharing it. I’ll find it extremely useful, I’m sure! I find it to be delightfully responsive — it displays all those viewer dots very quickly.
I have a couple of feature suggestions:
– When the blue dots for images do not plot on the comet, it can be difficult to figure out whether the dots are in front of or behind it. Perhaps a different color could be used for dots located between the comet and the viewer than for dots beyond the comet?
– It would be lovely to have the option to display a coordinate grid on the comet, or at least a set of XYZ axes for pole and 0/90/180/270 longitudes at equator
– it would be lovely if the ambient/theta/phi sliders displayed text feedback that informed the level of ambient lighting and longitude/latitude. I do like how clean the viewer is though. Maybe if the text was just displayed when the user was clicking on the slider?
– since it’s the most common request I get from readers, it would be nice to add the option of displaying a scale bar.
Thanks for your kind comment, Emily, and the nice review on your Planetary Society blog: everyone involved in the development of this tool is very appreciative.
On your suggestions for additional features, they’re all very good and indeed, we’ve had similar ideas in several cases. We will be implementing some fixes for known bugs in a few of the current feature set (e.g. the vertical drag-to-rotate only goes through 180 degrees), and we’ll take a look at what might be involved in increasing the feature set at the same time.
Some may be easy, some harder: “tool tip” type feedback on the lighting sliders will likely fall in the former category, while adding a variety of well-known sci-fi spaceships for scale (as suggested in a comment on your blog review) might be a little further out in the future 🙂
It’s also worth noting that the code itself has been developed as open source (as mentioned in the article above), and thus anyone can make modifications to the code as they see fit. We’ll be making the code and associated files available via one of the usual sites once we’ve arrived a stable version 1.0. If people make interesting changes, we could also implement some of them in a future version.
What a wonderful toy! Although I have been following your posts on a daily basis this viewer helps me understand much better how rosetta orbits the comet, how the comet looks like etc, etc. Thanks so much.
Would it not be possible to have a viewer similar to Google Earth. So as you soon in to any area of the comet more and more detail would be seen?
Hi All.
Using this awesome model I’ve created screenshot 3D anaglyphs…
Are there any plans to add a “3D” button directly to the webpage?
Thank you
Nathanial Burton-Bradford
Nice tool!
I also did some webgl programming to visualize Rosettas trajectory around 67P 🙂
https://www.googledrive.com/host/0B_Y5O4C6aiKmfktCSlJEb2N1d2h0WElIcEs1R081OXdfUS01MFV4Ukk4RGFGUllPMFNZZms
thanks for the marvellous access to your Rosetta findings – inspirational. One thing – I am a geologist and like all geologists when confronted with rock, even ice rock, we look for layering – lamination. Looking at some of the close images of the surface it is clear to me that at least parts of the comet are layered, at a thickness dimension of 2 to 5m or less. It is possible to miss this if the observers’ eyes are attuned to other aspects. The layering could reflect shells of accretionary ice/dust from its formative processes.