In a paper accepted for publication in the journal Astronomy & Astrophysics, the MIRO team present their first map of water vapour in the coma of Comet 67P/Churyumov-Gerasimenko.
MIRO, the Microwave Instrument for the Rosetta Orbiter, first detected the emission from water molecules in the coma of Comet 67P/C-G on 6 June 2014, when Rosetta was 350,000 km from the comet, approximately equivalent to the distance of the Earth from the Moon. At the time, the comet was 3.9 AU – about 580 million km – from the Sun.
Since early July 2014, the MIRO team have been continuously monitoring water in the comet’s environment, measuring its properties at different locations across the coma. Being in very close proximity to 67P/C-G, Rosetta, with the MIRO instrument on board, can ‘dissect’ the distribution of water and other molecules around the comet. Existing ground-based observatories and near-Earth space telescopes can at most get a global view of water in the outermost parts of a comet’s coma.
As Rosetta approached the comet and MIRO could resolve the nucleus, the instrument was able to detect water in the coma by measuring the direct emission from water vapour in the coma and by observing absorption of radiation from the nucleus at water specific frequencies as the radiation passed through the coma.
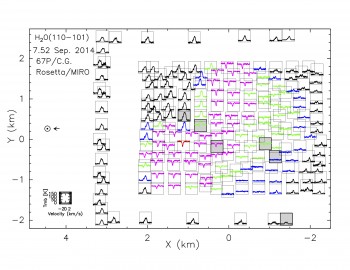
MIRO’s spectral map of water at Comet 67P/C-G, obtained on 7 September 2014. From N. Biver et al. (2015)
On 7 September 2014, when Rosetta was 58 km from the comet centre, the MIRO team obtained their first map of the nucleus of 67P/C-G and its surroundings. Since MIRO is a single-pixel instrument, the scanning procedure took almost four hours, during which the nucleus had turned by about 90 degrees.
The map shows 201 spectra, covering the nucleus as well as parts of the coma around it. Each spectrum corresponds to the average of one to four nearby spectra, that were combined to obtain a higher signal-to-noise ratio.
The strongest signatures of water emission are observed in the off-nucleus spectra on the comet’s day side; similarly, the strongest absorption features are seen in the spectra covering the day side of the nucleus. A few spectra sampling both coma and nucleus on the limb exhibit a combination of emission and absorption features.
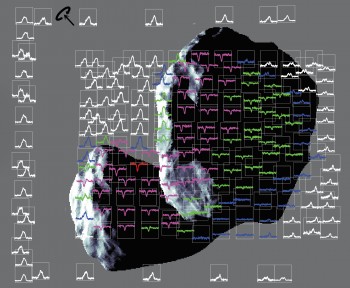
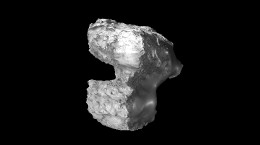
An indication of the position of each of MIRO’s spectra with respect to the comet nucleus. The Sun is to the left. Data from Biver et al. (2015); the nucleus is represented according to the comet shape model 5 from Jorda et al. (2015)
Weak absorption was observed in the spectra covering the cool nucleus on the comet’s night side, while only weak emission was detected over some of the coldest spots on the nucleus, with hardly any signs of water close to the south pole of 67P/C-G. The off-nucleus spectra on the night side also show weak emission lines from water in the coma.
This map was obtained using the spectral line of the H216O water molecule at a frequency of 556.936 GHz. An analogous, but coarser map was obtained using a much fainter spectral feature detected at a frequency of 547.676 GHz, characteristic of a different type of water molecule, H218O, which contains a heavy oxygen (18O) atom.
“Our observations show that the distribution of water in the coma is highly inhomogeneous,” explains Nicolas Biver, CNRS researcher at LESIA-Observatoire de Paris in Meudon, France, and lead author of the study.
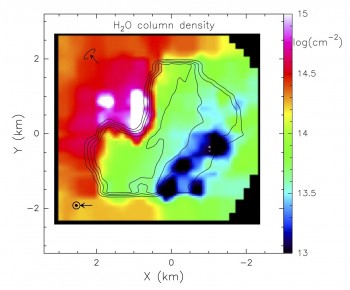
The column density of water around Comet 67P/C-G as measured by the MIRO instrument on Rosetta. From N. Biver et al. (2015)
“We found the highest density of water just above the neck, close to the north pole of the comet’s rotation axis: in this narrow region, the column density of water is up to two orders of magnitude higher than elsewhere in the coma,” adds Dr Biver.
Lower but still substantial amounts of water are detected over the day side of the nucleus up to the terminator between the illuminated and dark side. The lowest amounts of water are found on the comet’s night side – particularly over the southern polar regions; these could be due to either local outgassing or circulation effects within the coma, causing water to flow from the day to the night side.
Since last September, scientists in the MIRO team have obtained and are still analysing more maps of the distribution of water in the coma of 67P/C-G, as the comet is moving closer to the Sun.
Dr Sam Gulkis, Principal Investigator of MIRO, reports that the instrument is performing well, and observations of 67P/C-G are continuing daily as the comet approaches perihelion in August 2015.
MIRO: The MIRO instrument was built at the Jet Propulsion Laboratory, California Institute of Technology with contributions from LESIA and LERMA, Observatoire de Paris and the Max-Planck-Institut für Sonnensystemforschung. Funding was provided by the National Aeronautics and Space Administration, CNES and CNRS/INSU, and DLR and MPG.




Discussion: 32 comments
What is the sign convention for the velocity scale? Is positive towards Rosetta or away from Rosetta?
I imagine you’ve already figured this out Harvey, but from fig. 4 in the referenced paper, “……negative velocities, i.e., coming from gas moving toward Rosetta/MIRO,……..”
Been having trouble with the captcha thing, hopefully this works.
Harvey the answer is in the paper published about the measurements. If you open it and go to the chart you will find it. Sorry I have only had time to speed read so I will leave you to read it.
Regards
Thanks both; that’s what I’d guessed.
You will probably think this is a joke, but I’m travelling in Iceland (seems rather appropriate 🙂 ) with limited net access.
i failed the cAptcha code, i must be a robot
Since this is something I know a bit about, a few words of explanation.
What is being measured here is the 1(1,0) to 1(0,1) pure rotational transition of the water molecule. For the 16O isotope, the common one. The notation is J, the total angular momentum, followed by Ka and Kc, the projections of the total onto the a and c molecular axes.
Water is an ‘asymmetric top’, it has three different moments of inertia about three axes, and needs three quantum numbers to define its rotational state. In this transition the total angular momentum stays the same, and Ka and Kc both change by one, in opposite directions so to speak.
Such transitions are an EXTREMELY precise signature of the molecule involved. There is essentially no possibility at all of mistaking one molecule for another; OH for example is linear and would only involve J as it only has one moment of interia, and it’s absorptions would lie at far higher frequencies.
When the water is seen against the cold background of space, we see it emitting 557GHz. When against the relatively warm comet, we see it absorbing the comet’s thermal emission.
The shift of the line from the centre of the small square is the Doppler shift, giving the velocity of the molecule relative to Rosetta. There is a sign convention issue, question above.
Broad lines probably indicate a range of Doppler broadening, not pressure broadening. In a few cases both absorption and emission are seen at different Doppler shifts, close to the comet edge.
Broadly, since material going away from Rosetta can stretch to infinity, whilst material coming towards it only over the distance from Rosetta to the comet, one might expect stronger and maybe broader lines from material travelling away, giving a hint at the sign convention.
The diagram also shows the background temperature encoded as colour and the height of the background level of the mini graph.
The diagram packs a huge amount of information in and needs some careful thought! I think I have this right, but corrections welcome.
Just for those who are a bit confused by the states of the molecules Harvey is describing, there is an animation on this page:
https://www1.lsbu.ac.uk/wate/water_vibrational_spectrum.html
Mouse hover over it to see the different vibrational states.
Can’t disagree with any of that Harvey, but after a one week crash course, I’m not really in a position to!
This, as you know, has been used along with similar measurements in the infrared, to directly measure H2O in comets routinely for the last 20 years or so. These have been from ground based, airborne and in-situ measurements. I currently have papers reporting such findings from 13 different comets, and there are others, I’m sure.
It should also be noted that the water production rates made from these direct measurements are in very good agreement with production rates using OH in the 18cm line, at the same comets, showing that is also a valid way of estimating H2O production rates.
Despite what others may claim.
Yet again the link didn’t copy properly in my previous comment. Try this: https://www1.lsbu.ac.uk/water/water_vibrational_spectrum.html
ianw16. The link appears to be broken.
However it refers to *vibrational* stares.
MIRO measures a pure rotational transition of the vibrational ground state; no vibration of the molecule is involved.
Earlier measurements in the infrared, from Kuiper etc, did use infrared spectroscopy, typically of near infrared combination or overtone bands in which multiple vibrational quanta are excited.
Tutorial part two 🙂
For anyone who is interested.
With the second version of Ianw’s link, it works.
However MIRO’s measurements do not involve molecular vibration; the molecule remains in its vibrational ground state, ie not vibrating.
In fact it’s total angular momentum doesn’t change either (this is known as a Q branch transition) only components of it along the A and C axes (also quantised) change. The selection rule is plus or minus one, or plus/minus three (much more weakly) for Ka and Kc.
If you look at the red, ‘Vapour at 25C’ spectrum near 3800cm-1, it has a complex, ragged shape. Here the molecule changes both it’s vibrational state *and* it’s rotational state. Because the pattern of energy levels for this type of molecule is complex, and so are the selection rules, you get this messy shape. It’s caused by molecules originating in the ground vibrational state with differing amounts of rotational energy. If they increase their rotational energy in the transition, you get the lines above c3800, if the reduce it, the lines below c3800.
Three quantum numbers are needed to define a rotational state in asymmetric top molecules like water; no simple formula for the energy levels, number crunch the Hamiltonian.
Nice linear molecules like CO, CO2, NNO give a far simpler pattern of almost equi spaced lines. In some cases you get a strong central feature called a Q branch (eg CO2 near 16um.) only one quantum number, only J required in a simple version (plus l in perpendicular bands I know if any purist is reading!) very simple formula for the energy levels.
For completeness, molecules like ammonia (actually a rather special case) need two quantum numbers, J, total angular momentum, and K, projection on the top axis. They have two types of bands. The energy levels can be obtained from a simple closed formula.
Earlier measurements of H2O from Kuiper etc did use infrared measurements involving the vibrations. Generally ‘overtone’ or ‘combination bands’ have been used in the near infrared. They involve changing a vibrational quantum number by 2, 3 etc (overtones) or changing more than one vibrational quantum number. They are weaker, and more suitable for this type of measurement.
Thanks for that Harvey, I can reed the article again now.
regards
It is obvious that the water content in the coma around the comet is proportional to the the intensity of the photons from the sun. The rate of sublimation of water ice from the of the surface of the comet increases with increasing intensity of light. However, because of the rotation of the comet a boundary layer will be formed around the comet where the concentration of water will depend on rotation rate ( determine the momentum vector) and gravitational force. However, there is no significant gravitational force at the comet surface so that the boundary layer around rotating sphere on earth is very different that it is around the comet.
A ‘boundary layer’ is a viscous flow effect. A short distance from the comet it will become molecular flow as the pressure drops. As we don’t know the pressure, hard to say how far, but not very far; big ‘vacuum pump’ 🙂
Re M. Reda – ‘water density in coma is proportional to intensity from the sun’
I don’t follow your reasoning, looking at the column water density chart there are large differences in water density across the surface that would be difficult to attribute to intensity of light.
There must be something else happening, possibly surface variables, method of erosion variables and much more.
regards
There are almost certainly surface variables, such as whether there is more H2O present or more CO2, the depth of burial beneath the dust etc. Also, there is the strongly inferred surface water ice in the neck region., from spectral data: https://arxiv.org/abs/1505.06888
Given when this data was acquired, it isn’t surprising that the sublimation is not a perfect match based on the sub-solar point.
how can you messure water comming from certain areas ? with one pixel, and moving target with 60 km between yourself ? you measured the speed of the molecule, and calculated travel time, back rotated the Comet , but how to know, that it didnt offspring, from a drifferent area ?`
thx
Each pixel simply reports the water vapour integrated along that line of sight. You have to be careful interpreting the diagram.; it’s not a simple ‘picture of water at a location’; it’s all the water between you and the comet, or you and infinity, however it got there, wherever it came from.
Very interesting and welcome results from MIRO Claudia and helpful to see the spectral map superimposed on a photo of the nucleus in one particular orientation to give some clarification.
Being as brief as possible here, it is interesting, as they observe, that the strongest emission spectra occur immediately above the neck region and to a somewhat lesser degree beyond. There is also however a lesser but uniformly
spread emission detected on the opposite dark side of the nucleus, but it is played down with a couple of unlikely hypotheses, and the extent of it away from the nucleus is not shown because of the edge limit of the field. Surely it is the most significant aspect of the results.
On the map of water column density the fairly uniform density of water molecules near most of the nucleus surface, coloured green, is strongly evident. Above the edge of the nucleus close to the surface of the neck region however there
is an indication of a deeper red band of uniform thickness suggesting that water emission is occurring uniformly along that whole surface, forming a relatively narrow band with a boundary between that zone and the extension of the
“column”. What might the significance of this band be.
The density diagram is valuable and clearly shows and relates to the shape of the nucleus, and strongly indicates the distribution of emission sites. I would be grateful however of an explanation of the coloured scale, of water molecules in a plane, per cm squared. It is labelled as a log scale but appears to be linear and, despite the sharply contrasting colours has a range of only 13 to 15 overall. Perhaps I misunderstand this.
Revealing results and it would be interesting to see them discussed in the context of water discharge hypothesis, and to see the day to day variation that has occurred.
I don’t see your problem with the scale, it’s a log scale over two orders from 10^13 to 10^15. Each decade is divided into ten equal increments which is slightly unusual but perfectly valid. Just use your calculator; 13.3 is roughly 2*10^13 and so on.
It’s isn’t a ‘water discharge hypothesis’; this and a stack of other results prove that hypothesis; it was proven decades ago from Kuiper measurements for example.
Ok Harvey but it is an unhelpful way for the authors to express it. As usual clarity of communication does not appear to be a priority.
The hypothesis is not that water is discharged. The hypothesis you allude to and which has never been proven, certainly not by these results, is that water vapour is sublimated from solid ice which comprises the comet nucleus. And there are other hypotheses which could be encompassed by the discussion suggested.
There is no other VIABLE hypothesis which respects the laws of physics and known data. The instant there is I and any other scientist will take notice of it.
The solar wind stuff is simply not viable on multiple grounds, all of them by a very large factor.
On top of which the H/D isotope ratio is wrong, and we now know there is very little oxygen in the surface to sputter off anyway, the black gunk is organic.
Currently no one has proposed a remotely credible alternative to sublimation.
In your judgement of viability Harvey you rule out any effect of the solar wind despite having demonstrated many times yourself that you do not understand the nature, properties and behaviour of the solar wind. The very large factors you invoke are part of that demonstration. Up to now on this or any other mission neither does the data exist to specify the current density or energy of the solar wind near a comet nucleus.
The obviously viable hydrocarbon combustion/ plasma discharge mechanism I have proposed takes the hydrogen in the evolved water from the hydrocarbons, not from the solar protons. So the D/H objection you keep returning to is irrelevant. The solar protons provide energy for the reactions and the oxygen is a general constituent of all rock, including that which makes up the comet nucleus. The hydrocarbon layer rests on the rock of the nucleus and the reaction takes place at that interface, under the influence of a proton flux denser and more energetic by many orders of magnitude than the heliosphere background levels.
The viability therefore stands until the relevant data is forthcoming which might discount it. This would include temperature, composition and degree of ionisation of the discharge jets near the nucleus surface. Also required are current density and energy levels of protons and electrons mapped at points throughout the comet coma.
Similar rigour should be applied to any other hypothesis which purports to explain the behaviour of comets. Those who support the sublimation hypothesis need therefore to propose an approporiate set of measurementts to confirm or refute it. This has not been done up to now and all so called confirmations of the sublimation theory are themselves observational hypotheses.
Original john, your definition of viability and mine differ wildly. I require that things obey the laws of physics, are numerically credible, and match the data; you are untrammelled by such concerns.
You present no details at all of processes which are simply not feasible. They are plucked out of thin air; no details, no mechanisms, no numbers, no data in support. Just wild assertions without the faintest shred of a foundation to them.
My guess is that *whatever* data is forthcoming, you will never change your views. My posts are not intended to achieve that, it’s clearly impossible.
They are intended to prevent the interested public being mislead by pseudo scientific nonsense.
Re the scale.
I really don’t see an issue; I’ve seen this used before, though it’s not that common I agree. It’s probably standard output from the IDL data visualisation software or something similar. This was prepared for a scientific audience, not the general public, who are unlikely to understand 10^N anyway.
No scientist would have difficulty reading that scale.
Why the obsession with water vapor emanating from this comet, when there’s a menagerie of other chemicals spewing forth as well? Shouldn’t we be looking to correlate all data present in order to construct a comprehensive model of how a comet works? Since the “water” they’re detecting is simply the radical Hydroxyl, I would think that media coverage would start centering on de-mystifying this stellar object, and not regurgitating the same flawed theory over and over.
You obviously didn’t read the article very well.. They detected water. That is H2O. not OH, which has a totally different line. Try Googling “water at 557 Ghz”. You’ll find it’s water. You know, the stuff you drink?
Well to be absolutely fair, not the stuff you drink; the stuff you breath in and out as water vapour.
Rotational transitions like this are not seen in the liquid phase. Collisions occur at a higher rate than the molecule rotates, so the rotational states ‘loose their identity’ in the liquid phase.
But most certainly H2O!
Peon. This is absolutely unambiguously the water vapour molecule, H2O. There is no possibility whatever they are detecting OH. It’s absorptions lie at completely different, far higher frequencies.
Aside from its inherent importance,mother ability to get velocity measurements via Doppler shifts is of great use in understanding the mechanisms in the coma.
True Harvey, but I was exaggerating for effect. Purely to distinguish between OH, which this isn’t, and good old H2O.
If we managed to capture enough of it, returned it to Earth, and placed it in a room at standard Earth temp and pressure, I’m sure it would condense to form something I’d be more than happy to top up a single malt with!
So am I; but it might be a rather expensive glass of water 🙂
Retry. Just for fun I worked out where the lowest frequency rotational transition of the IOH radical lies; it’s around 1135GHz, miles away from this water vapour line.
Strong emission spectra above the neck region yes, but also reasonably strong on the opposite side of the nucleus, the dark side. You would expect this to elicit some considered comment, not a couple of throwaway ad hoc explanations. Field also chopped on the dark side.