

An international team of researchers has restored an original Apollo instrument and, using data from those missions, has published new maps of the fluorescence produced by materials on the lunar surface. Interpreting these ‘vintage’ data proved to be a challenge.
In July 1971, Apollo 15 opened a new phase in the exploration of our natural satellite, with a series of innovations that included a Lunar Module capable of extended stays and, for the first time, a Lunar Rover. Its Command and Service Module (CSM) carried more scientific instruments to scan the lunar surface. But one instrument in particular would collect data that would arouse the curiosity of astrophysicists decades later.
Apollo 15 was the first mission to use the X-ray fluorescence spectrometer. Astronaut Al Worden operated it during his solitary orbits while colleagues Dave Scott and Jim Irwin made their landing. Apollo 15 would also use this instrument on the journey home from the Moon.
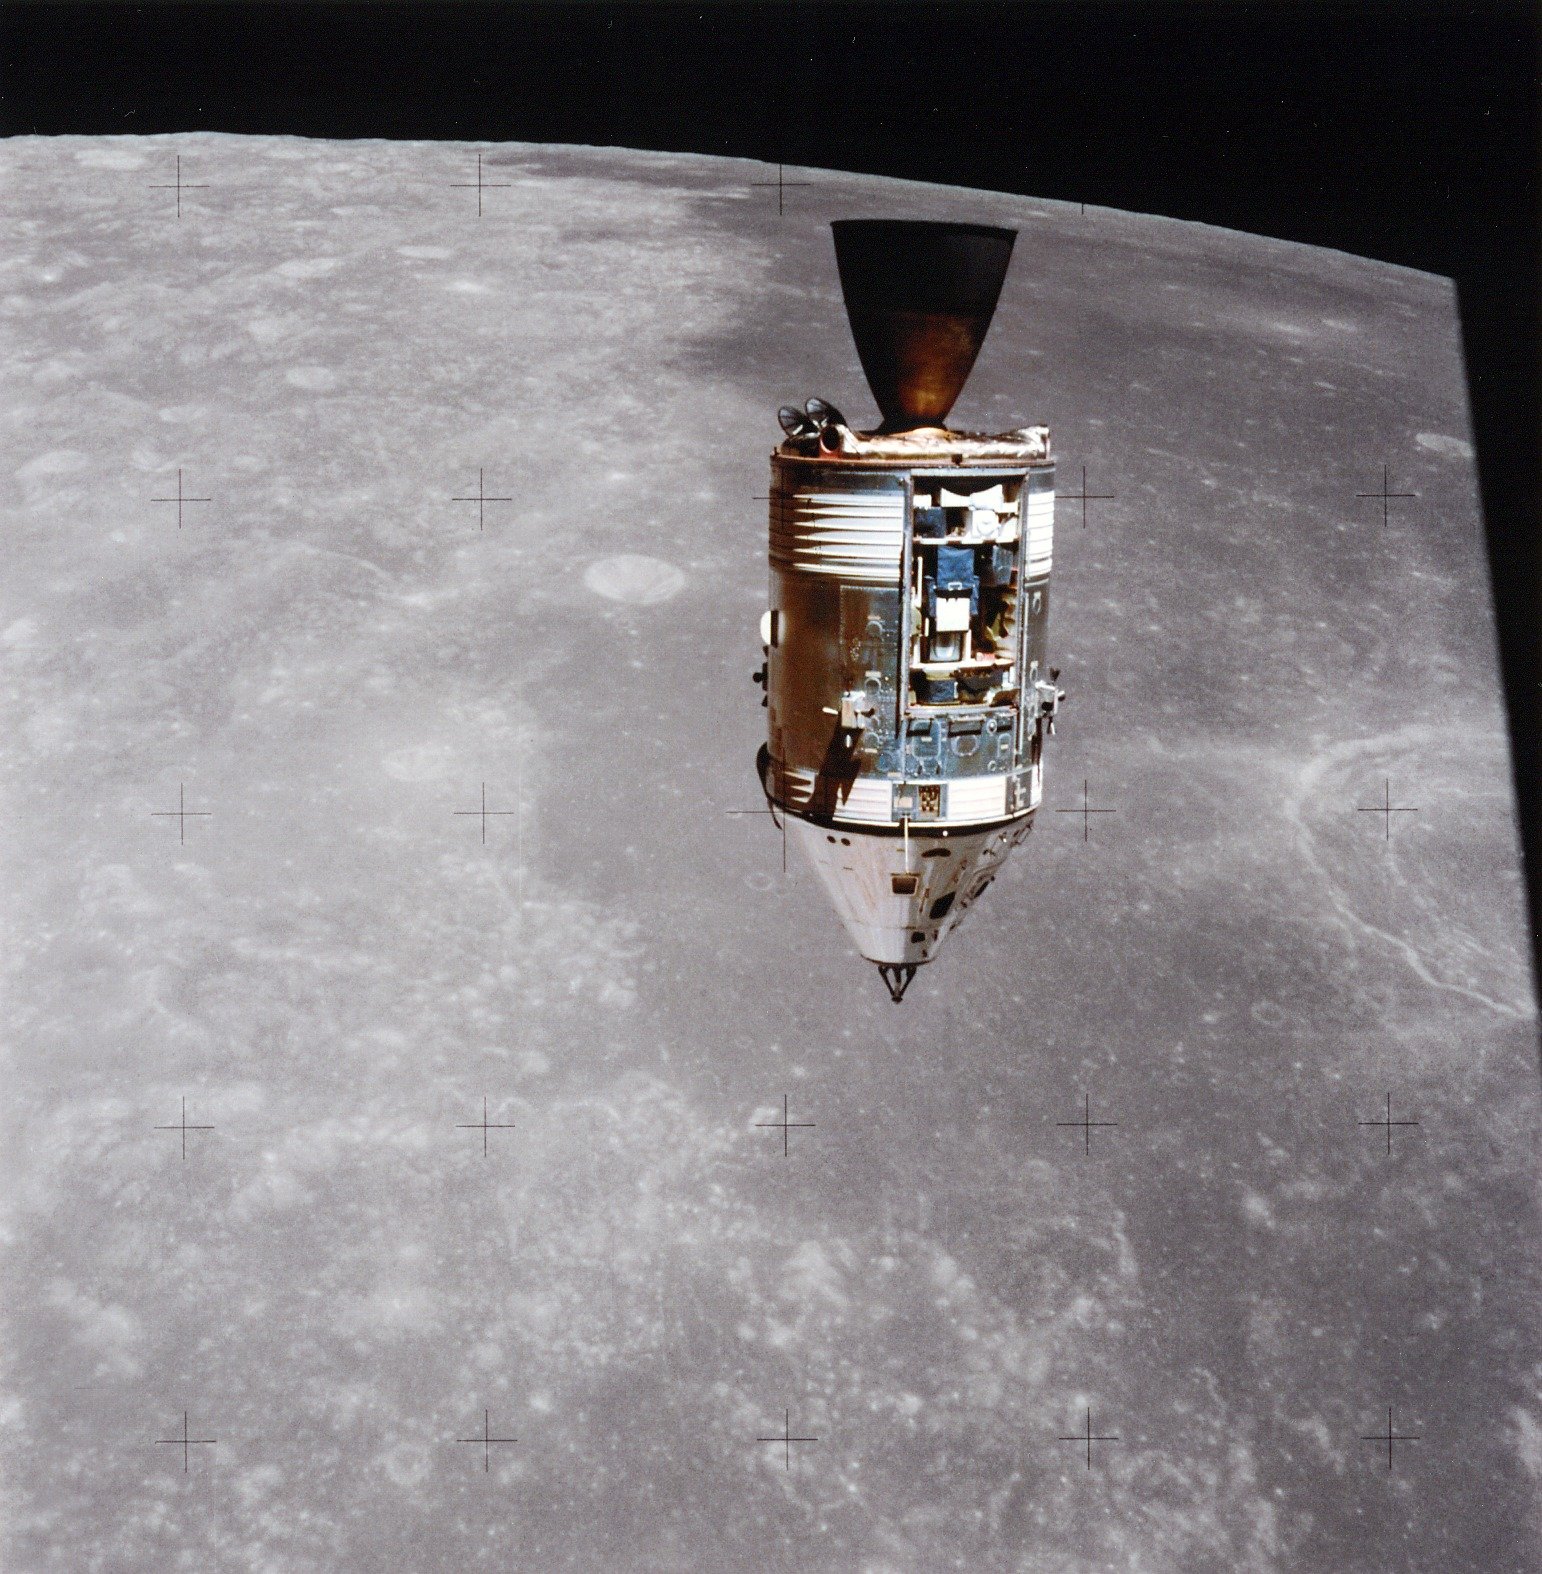
Apollo 15 Command and Service Module in orbit around the Moon. Credits: NASA
In the 1960s, the field of gamma and X-ray astronomy was still very new. “Discussion about the science on lunar missions began around 1965, and there was also talk of X-ray observations,” explained Erik Kuulkers, an astrophysicist based at ESA’s ESTEC facility in Noordwijk, the Netherlands, and project scientist for ESA’s Integral satellite.
“There was an announcement of opportunity for X-ray instruments around 1969, and that’s how this spectrometer ended up on Apollo 15 and 16 and became the first to discover an extrasolar X-ray source, Scorpius X-1.”
Kuulkers came across these data almost 40 years later, in 2008. He was studying a neutron star that was devouring its companion star about 4000 light years from Earth. “I was looking at some old data from 1969 and found an article that referred to a brief flash of X-rays from this source, Centaurus X-4, which had been seen by an instrument on Apollo 15,” recalled Kuulkers.
For Kuulkers, passionate about the Apollo programme, being able to get work with astronomical data dating back to those epic space missions seemed like a scientific dream come true.
Obtaining these data, however, was harder than expected. Finding no trace of them in the NASA archives, Kuulkers turned to the internet. Soon he found the data in another archive – but on magnetic tape.
With the help of computer engineering student Yoan Mollard, then an ESA intern, he decoded these tapes in 2012 and could begin to examine these observations collected over the three days that Apollo 15 took to return to Earth in August 1971.
Meanwhile, he realised that the same dataset also contained observations of the lunar surface. “These were in Ascii format, which is much easier to read, so I thought it would be interesting to reanalyse these too.”
But first, to make sure that the X-ray flash observed was actually the star he was interested in, Kuulkers needed to examine directly the instrument’s calibration.
While Apollo 15’s CSM circled the Moon in 1971, its spectrometer looked at the lunar surface (the same would happen several months later, in April 1972, with Apollo 16’s CSM flown by Ken Mattingly). It detected X-rays produced by the Moon’s surface in response to solar radiation.
“This is called fluorescence: different materials on the surface of the Moon absorb solar photons and re-emit them,” explained Anniek Gloudemans, a PhD student at Leiden Observatory in the Netherlands, who worked with Kuulkers in 2018, also as an intern at ESA.
“These instruments had to be manufactured very quickly,” explained Kuulkers, so their design was kept simple; they would record the presence of only three elements: magnesium, aluminium and silicon.
Two of the instrument’s three detectors each had a filter, respectively for magnesium and aluminium, and the third detector had no filter: by comparing the signal received from each of the three detectors, the relative concentrations of the different elements could be calculated.
If these basic observations of the 1970s laid the foundations for the study of lunar geology and the processes that contributed to the formation of its surface, interpreting the data from half a century ago was anything but trivial.
Information on the instruments was scarce, and existing literature on the subject was not always very descriptive. The researchers found contradictions in these publications, from the size of the various detector elements to the materials used. “We spent the first two months just trying to figure out what the thickness of the filter was in front of the detectors,” recalled Gloudemans.
“The instruments were made with very tight deadlines and bypassing a lot of documentation,” said Riccardo Campana, a researcher at the National Institute of Astrophysics in Bologna and an expert of simulations for high-energy astrophysics instrumentation.
Campana worked with Kuulkers and colleague Merlin Kole of the University of Geneva, to put together a physical description of the spectrometers, from which the ‘response’ could be reconstructed – how the detector signal translated into radiation actually received.
All the elements of the spectrometer’s geometry, from the sizes and distances between components, could be entered in a computer simulation and adjusted. From this, the team could find the combination that best reproduced the published values.
However, according to Campana, “What came out of the simulations did not match what was published. Without the instrument itself, we could not conclude anything.” After numerous attempts, the project appeared to have reached a dead end.
Meanwhile, interesting information emerged. Kuulkers discovered that, in addition to the two instruments flown on the two Apollo missions, a prototype still existed, abandoned in a basement of the Center for Astrophysics at Harvard. “At a certain point the centre contacted me,” he says with amazement. “And asked if I wanted it. I replied: certainly!”
After making shipping arrangements (the detector contained beryllium and required special precautions) and an agreement to never use it commercially, Kuulkers received the prototype for analysis in ESA ESTEC’s laboratories.
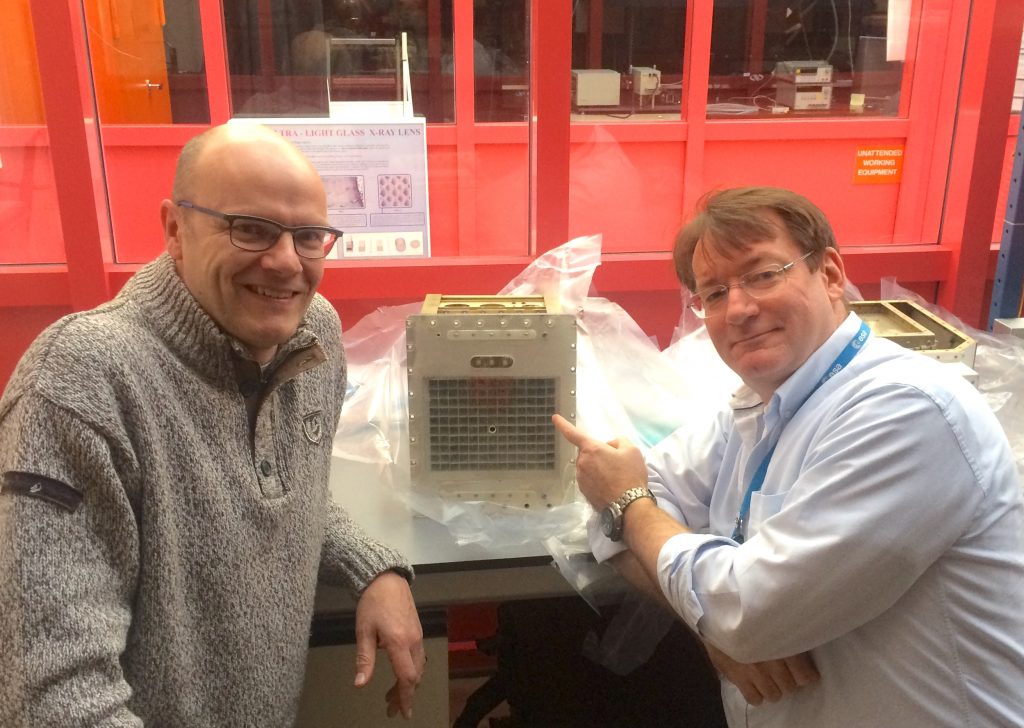
ESA Integral project scientist Erik Kuulkers (left) with the Apollo X-ray spectrometer prototype, and ESA History editor Carl Walker (right). Credits: ESA
With precise dimensions, the team could now determine the instrument response and understand which, of the different sets of parameters published in various articles, was the correct one. “Since we could not find any description of the material that the collimator was made of, we also broke a piece and had it chemically analysed,” said Kuulkers.
This analysis of the prototype gave a more accurate estimate of the visual field – what the instruments actually saw. But a new calculation of the Apollo spacecraft orbits around the Moon, developed by Alfredo Escalante and other collaborators at ESA’s ESAC centre near Madrid, helped to improve the calibration of the observations even further.
Kuulkers wasn’t satisfied. “We wanted to understand how they made the observations,” he said. All astronaut activities were logged in NASA archives, except for descriptions of the astronomical observations. The astronauts’ own notes had never been published.
He contacted another Apollo 15 astronaut, Commander Dave Scott. “Interviewing David Scott was very useful: for some observations we were able to determine exactly where they were aiming.”
The result was three maps of the lunar surface, showing the intensity of the fluorescence emission produced by aluminium, silicon and magnesium. These are the largest maps ever obtained from these data, even though they cover only about 10 percent of the Moon’s surface (the rest was not visible to the instruments from the orbits flown by Apollo 15 and 16).
Although these observations represented only a thin top layer of the surface material, a few centimetres deep, they still contained information on the evolution of the lunar surface, and there were differences from the maps of the 1970s.
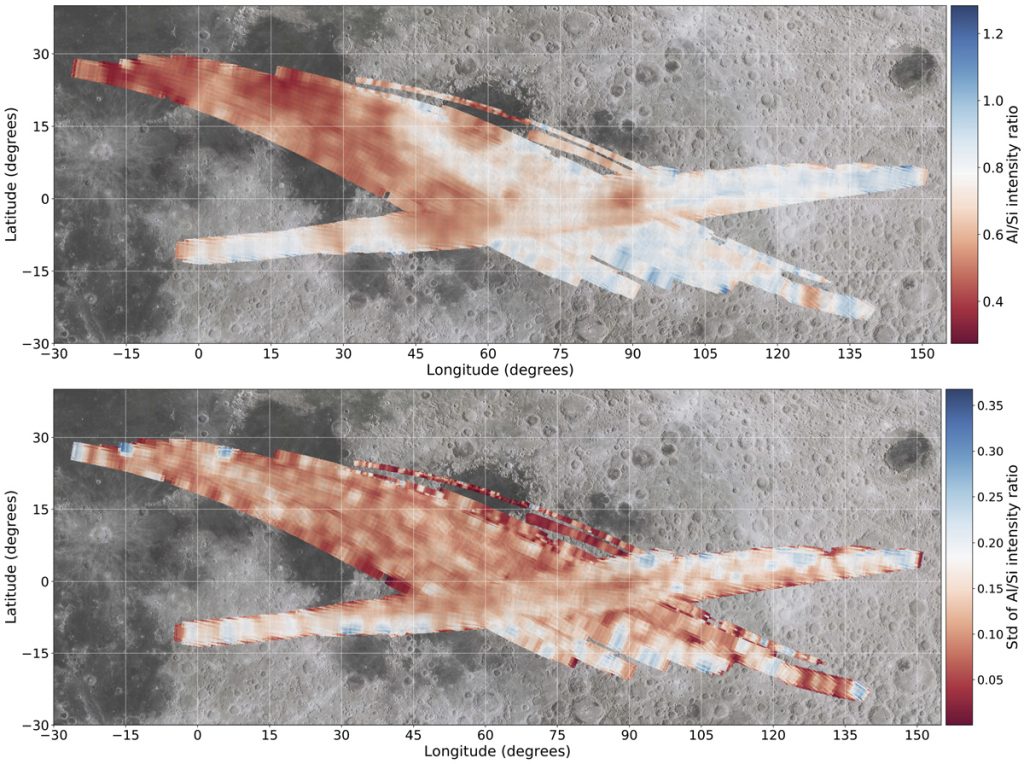
Example lunar map showing silicon and aluminium density.
“The maps confirmed aluminium-rich highlands and relatively magnesium-rich maria. But the most interesting fact is that when we look at the ratio between aluminium and silicon, it is 30 percent lower than in the literature,” explained Gloudemans.
The team’s results can be compared with those of much later X-ray fluorescent experiments (such as ESA’s SMART-1 and ISRO’s Chandryaan-1/C1XS), and their maps are in agreement with low-resolution global maps derived from the Chang’E-2 X-ray spectrometer.
None of the team have any doubt that there is still much to be drawn from these observations. The X-ray instruments of Apollo 15 and 16 offered, and still offer, the opportunity to have complementary and simultaneous data to some of the first observations of X-ray sources in history.
Having reconstructed the response of the instruments, astrophysicists will be able to reexamine all the X-ray observations carried out by these missions, especially those of the cosmic sources recorded on their journeys back to Earth, those from which, 13 years ago, this research originated.
In 2019, Kuulkers met up with Al Worden at Kennedy Space Center and gave him one of the new lunar maps. “We closed the circle. Al made the observations, we did the analysis and we returned the results to him.” Kuulkers confirmed Worden’s interest in the research into the data he’d collected. “Unfortunately, Al passed away in March 2020, which is why we dedicated our paper to his memory.”
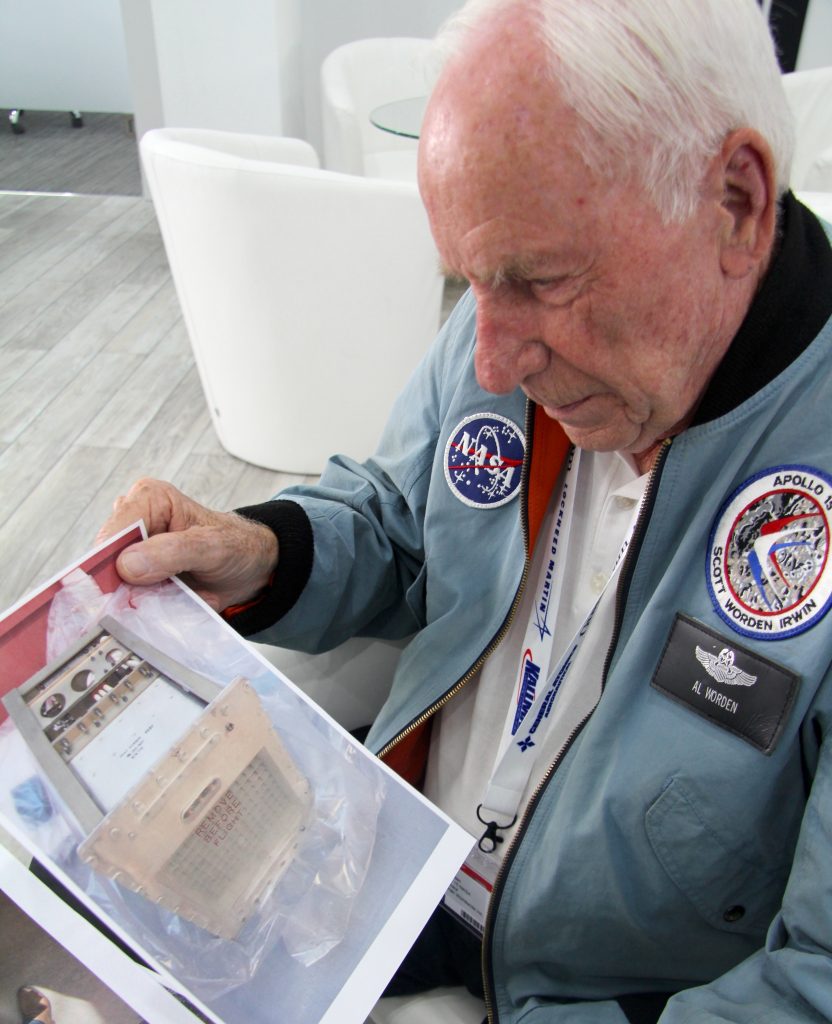
Apollo 15 astronaut Al Worden views a photo of the restored X-ray instrument in 2018. Credits: ESA
The Apollo X-ray spectrometer prototype instrument is now on public display at the Space Expo museum near ESA ESTEC in Noordwijk.
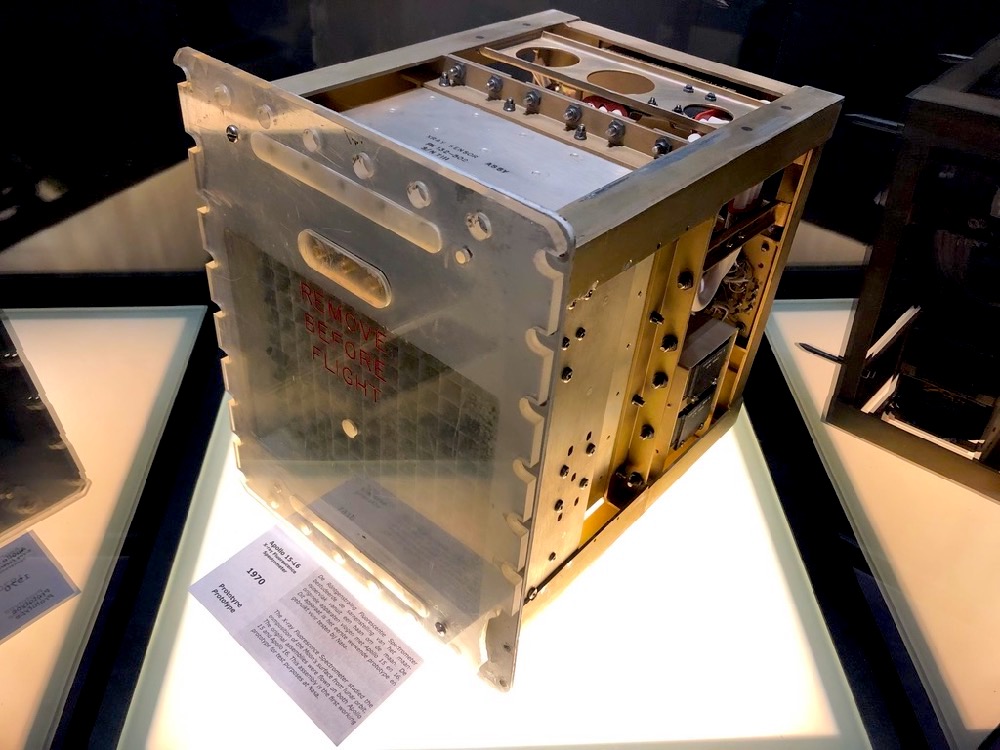
The Apollo X-ray spectrometer unit on display at Space Expo in Noordwijk. Credits: ESA
Original article in Italian by Claudia Mignone, published 02/08/2021 at https://www.media.inaf.it/2021/08/02/cold-case-fluorescenza-lunare/