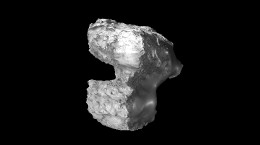
Brief but powerful outbursts seen from Comet 67P/Churyumov–Gerasimenko during its most active period last year have been traced back to their origins on the surface.
In the three months centred around the comet’s closest approach to the Sun, on 13 August 2015, Rosetta’s cameras captured 34 outbursts.
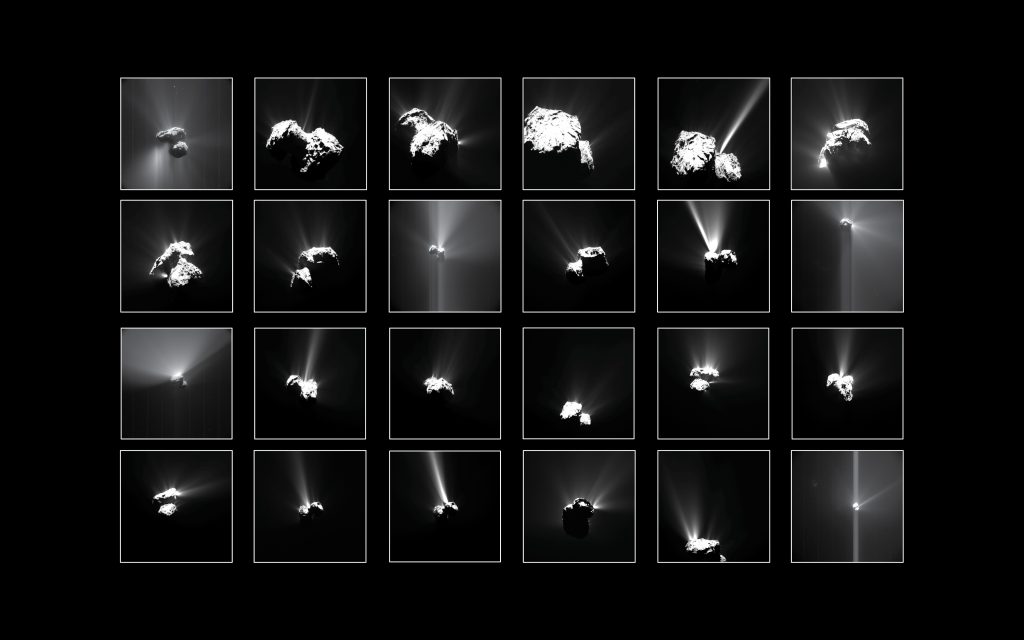
Compilation of the brightest outbursts seen at Comet 67P/Churyumov–Gerasimenko by Rosetta’s OSIRIS narrow-angle camera and Navigation Camera between July and September 2015.
Credits: OSIRIS: ESA/Rosetta/MPS for OSIRIS Team MPS/UPD/LAM/IAA/SSO/INTA/UPM/DASP/IDA; NavCam: ESA/Rosetta/NavCam – CC BY-SA IGO 3.0
These violent events were over and above regular jets and flows of material seen streaming from the comet’s nucleus. The latter switch on and off with clockwork repeatability from one comet rotation to the next, synchronised with the rise and fall of the Sun’s illumination.
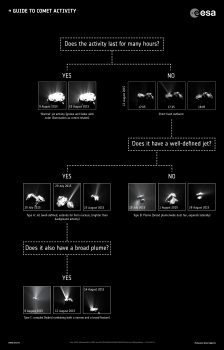
How to spot the difference between ‘normal’ background activity and short-lived transient events at Comet 67P/Churyumov–Gerasimenko. Click for large image, full caption and credit info.
By contrast, outbursts are much brighter than the usual jets – sudden, brief, high-speed releases of dust. They are typically seen only in a single image, indicating that they have a lifetime shorter than interval between images – typically 5–30 minutes.
A typical outburst is thought to release 60–260 tonnes of material in those few minutes.
On average, the outbursts around the closest approach to the Sun occurred once every 30 hours – about 2.4 comet rotations. Based on the appearance of the dust flow, they can be divided into three categories.
One type is associated with a long, narrow jet extending far from the nucleus, while the second involves a broad, wide base that expands more laterally. The third category is a complex hybrid of the other two.
“As any given outburst is short-lived and only captured in one image, we can’t tell whether it was imaged shortly after the outburst started, or later in the process,” notes Jean-Baptiste Vincent, lead author of the paper published today in Monthly Notices of the Astronomical Society.
“As a result, we can’t tell if these three types of plume ‘shapes’ correspond to different mechanisms, or just different stages of a single process.
“But if just one process is involved, then the logical evolutionary sequence is that an initially long narrow jet with dust is ejected at high speed, most likely from a confined space.
“Then, as the local surface around the exit point is modified, a larger fraction of fresh material is exposed, broadening the plume ‘base’.
“Finally, when the source region has been altered so much as not to be able to support the narrow jet anymore, only a broad plume survives.”
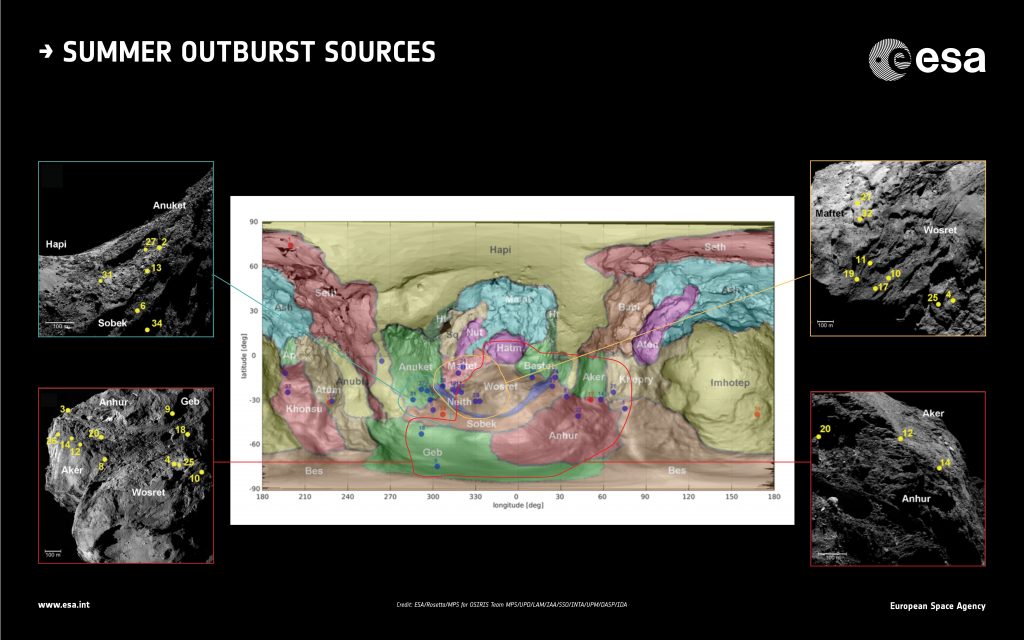
Locations of the summer outbursts observed by Rosetta’s OSIRIS (blue dots) and NavCam (red dots) between July and September 2015, superimposed on a regional map of Comet 67P/Churyumov–Gerasimenko.
Click for full caption details.
Credits: OSIRIS: ESA/Rosetta/MPS for OSIRIS Team/MPS/UPD/LAM/IAA/SSO/INTA/UPM/DASP/IDA
The other key question is how these outbursts are triggered.
The team found that just over half of the events occurred in regions corresponding to early morning, as the Sun began warming up the surface after many hours in darkness.
The rapid change in local temperature is thought to trigger thermal stresses in the surface that might lead to a sudden fracturing and exposure of volatile material. This material rapidly heats up and vaporises explosively.
The other events occurred after local noon – after illumination of a few hours.
These outbursts are attributed to a different cause, where the cumulative heat makes its down to pockets of ‘volatiles’ buried beneath the surface, again causing sudden heating and an explosion.
“The fact that we have clear morning and noon outbursts points to at least two different ways of triggering an outburst,” says Jean-Baptiste.
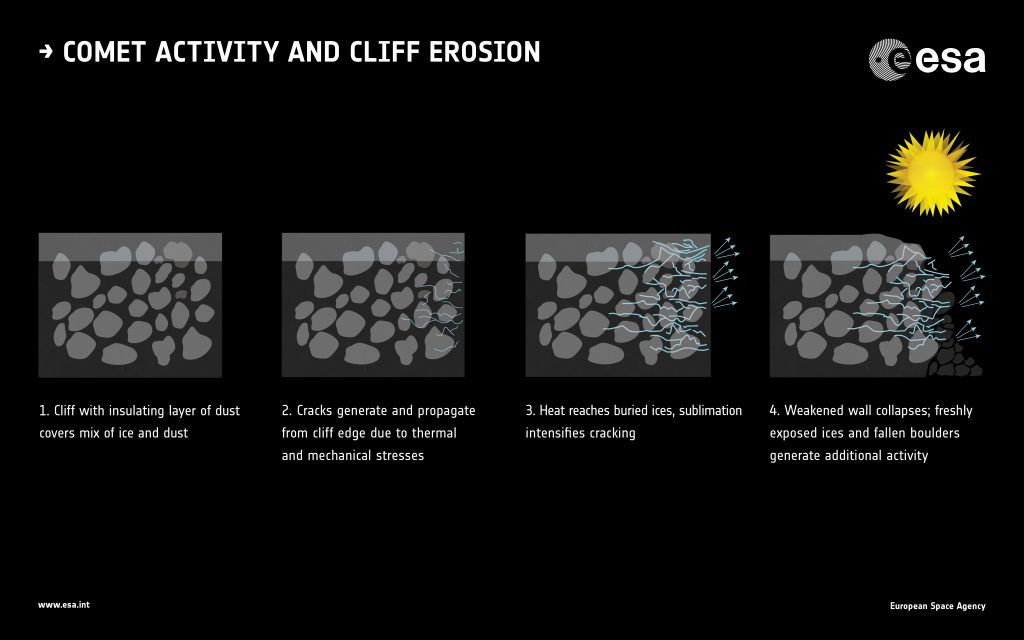
Cliff collapse and comet activity. Click for full caption details. Credits: Based on J.-B. Vincent et al (2015)
But it is also possible that yet another cause is involved in some outbursts.
“We found that most of the outbursts seem to originate from regional boundaries on the comet, places where there are changes in texture or topography in the local terrain, such as steep cliffs, pits or alcoves,” adds Jean-Baptiste.
Indeed, the fact that boulders or other debris are also seen around the regions identified as the sources of the outbursts confirms that these areas are particularly susceptible to erosion.
While slowly eroding cliff faces are thought to be responsible for some of the regular, long-lived jet features, a weakened cliff edge may also suddenly collapse at any time, night or day. This collapse would reveal substantial amounts of fresh material and could lead to an outburst even when the region is not exposed to sunlight.
At least one of the events studied took place in local darkness and may be linked to cliff collapse.
“Studying the comet over a long period of time has given us the chance to look into the difference between ‘normal’ activity and short-lived outbursts, and how these outbursts may be triggered,” says Matt Taylor, ESA’s Rosetta project scientist.
“Studying how these phenomena vary as the comet progresses along its orbit around the Sun give us new insight into how comets evolve during their lifetimes.”
Notes
This article is mirrored from the main ESA web portal.
“Summer fireworks on Comet 67P,” by J.-B. Vincent et al is published in Monthly Notices of the Royal Astronomical Society
This article also uses information from “Are fractured cliffs the source of cometary dust jets? Insights from OSIRIS/Rosetta at 67P,” by J.-B. Vincent et al, published in Astronomy & Astrophysics 2015
Of the 34 outbursts, 26 were detected with the OSIRIS narrow-angle camera, three with the OSIRIS wide-angle camera, and five with the Navigation Camera.



Discussion: 40 comments
The study of these summer outbursts highlights an issue that is yet to be resolved regarding the thermo-physical models of comet nuclei.
The issue is described in section 7 of the following Rosetta science summary paper (paper summarising and contrasting conclusions from hundreds of recent papers) Link follows:
https://m.mnras.oxfordjournals.org/content/462/Suppl_1/S2.full
Quoting from there:
“The 67P surface has a very low thermal inertia, close to 20 J K−1 m−2 s−0.5 (Schloerb et al. 2015)”
“Even if the nucleus were composed of pure ice from a depth of 1.5 cm downwards, the entire surface of 67P would release a negligible water fraction of that observed (Gulkis et al. 2015; Keller et al. 2015b). This proves that all the water-vapour is coming from the uppermost surface layer thinner than 1 cm”
Personally, I just cannot reconcile such a low thermal inertia, and the requirement that the water ice be close to the surface, and it’s latent heat absorbing the sun’s rays, with the requirements for an outburst that ejects tonnes of material.
Local Thermal Equilibrium is a perfectly reasonable assumption that fails to explain any of the surface events.
Low thermal inertia is measured, but a very high thermal inertia is required for many of the outburst events.
This extremely low thermsl inertia points towards a very fluffy dust layer. Who knows, how thick this layer is, and how the thickness of this layer varies over the surface.
Hi Gerald,
Which part of:
7 THERMO-PHYSICAL MODELS FAIL
From the referenced paper did you not understand?
“Fluffiness” doesn’t explain anything, and neither does varying thickness. It is hand waving the contradictions away.
There are no thermo-physical models that passed the test of matching Rosetta’s observations to theories. It is basically back to the drawing board.
Hi Marco,
read and understand more than the headline:
“The fact that all thermo-physical models of comets assume LTE (Prialnik et al. 2004) may explain why they fail most predictions.”
The straightforward conclusion is, that the LTE simplification of the applied models is too strict.
Refining the models takes time, so I’d recommend not to draw premature conclusions.
This is mostly a justification and motivation for future work.
Don’t forget, that the Rosetta mission is still early in data analysis.
… or consider ” A dust layer much thinner than the size of the ejected dust has little physical sense, but is still a common assumption of models of water ejection (Keller et al. 2015b).”
The simple approach would be to assume a thicker layer of fluffy dust.
Hi Gerald,
I have read and understood the whole paragraph as well as the implications:
“The fact that all thermo-physical models of comets assume LTE (Prialnik et al. 2004) may explain why they fail most predictions”
We are talking about hundreds of papers coming to varying conclusions used as inputs to other papers. The point is that LTE is a perfectly reasonable assumption that should go closer to 67P observations with higher resolution or sophistication, when clearly, they don’t.
How does a fluffy, irregular surface ensure the kind of dis-equilibrium that could better predict actual nucleus properties?
LTE is pretty much applying the laws of thermodynamics with “reasonable” assumptions of the interior properties and thermal dynamics. At some scale it should be predictive if those assumptions are correct. The fluffiness or layer thickness can be modelled within LTE, while deeper convection movements are not considered “reasonable” assumptions. At some point “unreasonable” assumptions must be considered in “future work” and “refining models”
Hi Marco,
the models make several assumptions. If only one of these assumptions turns out to be too strong, then they risk to fail describing the comet.
That’s pure logic in a first step. Then look a little closer at the model assumptions:
How can LTE be obtained between dust and gas by a gas flowing faster than its speed of sound (relative to the dust)?
LTE is not as self-evident as you suggest. An example:
“Our results indicate that assumptions of local thermal equilibrium and/or the coupling of the dust and gas phases in star-forming regions may not be as robust as commonly assumed.”
(https://arxiv.org/abs/1212.1429)
A dust layer thinner than the grain size is certainly nonsense, So how can you conclude, that all “reasonable” assumptions are already covered by the considered models?
It’s more obvious, that at least the assumption of an only very thin dust layer desn’t hold. The very low thermal inertia very strongly suggests a considerably thicker dust layer than just a grain or less.
Hi Gerald,
LTE is not self evident so much as LTE should in principle have enough variable parameters to “fit” with the evidence of the comet. Thickness of the surface layer and its porosity is *not* an open question. Various instruments in combination can narrow down the possibilities both of thickness and variability of the surface layer. Dust and gas *on the surface* is easily constrained in terms of estimated thermal flows. Essentially, you can get some conduction downwards depending on conductivity (Last year, I suggested Graphene as a potential highly conductive material), but convection can only reasonably carry heat outwards. Thus the “reasonable” properties suggest a thermal flow from sun to surface conducted down a little, then lost as latent heat transferred to the gaseous phase and then ejected outwards towards the vacuum of space, taking the heat with it, as well as some mechanical energy transferred to a high dust ratio.
This suggests a fairly tight energy loop within the top layer limited by how far the thermal energy can be conducted down effectively before being lost to latent heat. At most scales this *should* average closely to LTE given many parameters such as measured temperatures and outgassing.
However, as you say, LTE has effectively been falsified. My solution is, of course, to suggest that a only a model that includes an internal store of energy could both fit Te evidence and not break the laws of thermodynamics.
Hi Marco,
well thermodynamics on a microscopic scale or under extreme non-equilibrium conditions is so complex and poorly understood, that I’m not sure, whether it’s easy to find out whether an observation fits to the laws of thermodynamics or not.
That aside, as long as you’re suggesting some unspecified internal store of energy, that’s well possible. I’d think, that clathrates as well as low-temperature phases of water ice might undergo a transition to a metastable state, where they might release some latent heat, when changing phase or decomposing. I could also imagine, that clathrates may start decomposing, but still contain pressurized bubbles of gas.
I’d think, that nobody can currently tell with certainty in all detail, how the ices and possibly clathrates decompose.
A thermal conductor like graphene, however, doesn’t look supported by any evidece. Nor does convection by some liquid.
Hi Gerald,
I am sure that an internal energy source is certainly a better path to a model that can come closer to matching observed outflows than hand waving about non equilibrium thermodynamics.
However Graphene (or high molecular weight PAH’s) and liquid water shouldn’t be written off because “there is no evidence for them”
We have no evidence other than the blackness of what is on the surface so we can neither confirm nor deny the material that is on the surface.
We have no evidence of the interior temperature, pressure or state of the materials deeper than a few centimetres of the visible surface, so we can neither confirm nor deny the existence of liquids.
Same with ices or clathrates – we have no direct evidence and we have no model that fits the thermo-physical evidence.
Hi Marco,
you’re funny calling my version handwaving, just to continue with your own even more fringe an unevidenced ideas.
… show me a dust grain with the mica-like appearance of graphene.
Next, show the electric properties of aligned graphene in the microwave data.
You need this aligned grahene crystals for your thermal conductivity.
The mere plausible presence of PAHs doesn’t imply in any way the presence of graphene or even the large-scale alignment of graphene crystals you would need for your desired thermal properties.
The data to investigate this question are there. Dig into them, and look for evidence.
The dielectric data say, that the underground is icy and very porous, like fluffy dust and snow, but combined with the dust grain analysis probably even finer-grained with a highly fractal topology.
That’s neither consistent with graphene nor with liquids.
(Second try comment box ate it): the paper is available free here:
https://m.mnras.oxfordjournals.org/content/early/2016/09/21/mnras.stw2409.full.pdf
Thanks J.B. Vincent and RAS!
Hi Emily
There’s an error in the caption to fig. 7 in the ‘Summer Fireworks’ paper I linked above.
The text labelings in the caption for photos a to d have been rotated anticlockwise. So the caption label denoted ‘a’ actually refers to photo b; caption label for ‘b’ refers to photo c; caption label for ‘c’ refers to photo d; and then there’s a ‘d’ in the caption with no label except that it must refer to the text, “associated with pits and niches in Maftet and Wosret” which comes before the caption label a. That’s why I think it must be a simple anticlockwise shunting of the labels.
I wasn’t going to mention it because the regions are labelled on the photos anyway. However, a casual reader may still latch onto the erroneous caption and think the regions in the photo are nearby regions, sub-regions or specifically named features. And even as someone who knows these features really well, it took me several minutes to work out in what way the caption is at odds with the photos.
1) The location of outburst 27 in the paper corresponds exactly to Marco Parigi’s rockfall at Anuket linked here:
https://marcoparigi.blogspot.co.uk/2016/06/rockfall-in-anuket-sah-region.html?m=0
And annotated in finer detail here:
https://marcoparigi.blogspot.co.uk/2016/06/more-on-rockfall-area.html?m=0
The Vincent et al. yellow dot for 27 is inside Marco’s small blue circle i.e. placed right on top of the pile of rocks that he identified as having fallen.
2) Outburst 31 occurred six hours after outburst 27 and at the other end of this overhanging cliff. 31’s location is kissing the tip of the red massif that I identified as dropping down, rather like its rockfall cousin, but without breaking up. The collapsed red massif is shown in the second link above.
So, now that a peer-reviewed paper has placed outburst locations right on top of these two observed changes, with 10-metre accuracy are we going to allow ourselves to believe what was already blindingly obvious in Marco’s photos published back in June 2016 and completely ignored or otherwise criticised since?
@A. Cooper,
What criticism? I’m too lazy to trawl through umpteen threads looking for it.
I, for one, would not have criticised anybody for suggesting that cliffs collapse. It is one of the most obvious explanations for outbursts, as well as the ice rich ‘boulders’ seen at the foot of many of them.
This had already been noted in the paper:
‘Are fractured cliffs the source of cometary dust jets?
Insights from OSIRIS/Rosetta at 67P/Churyumov-Gerasimenko.’
Vincent, J.-B., et al.
https://arxiv.org/pdf/1512.03193.pdf
As they say: “These active walls present many signs of ongoing erosion. Large debris fields can be observed below the cliffs, interpreted as blocks falling down from the wall. The cliffs upper edges display mass wasting features, with the upper dust layer seemingly flowing down as the edge of the cliff collapses.”
A cliff collapse had already been noted in the above paper, in fig. 8
So, well done for spotting it, but it is not a huge surprise to anyone that cliff collapse happens. And that it is likely responsible for a number of the outbursts seen, as well as a lot of the regular outgassing.
Perhaps it was the mechanism suggested for the collapse that was being criticised?
Hi Ianw16,
I really have no idea what you are talking about when you say “A cliff collapse has been noted” in the papers. I have read hundreds of papers and I have not seen a single before and after image *PROVING* that any such cliff collapse has taken place. Have you considered the possibility of pareidolia or some kind of spurious parallax effect?
Hi Marco,
to be clear: The annotations in your post referenced by A. Cooper show clearly confusion and pareidolia on your side. But I agree with you, that this can sometimes even happen easily to very-well-trained observers, when a change is close to the limits of perceptibility..
So double and triple checking is certainly a good advice. Usually they’re doing this before publishing.
Accurate 3d-shape models help reducing this source of errors. And there are some other image processing techniques, which provide the surface structure much clearer than just looking at more or less raw images. One of them is hipass filtering.
Hi Gerald,
You say that it takes time and careful viewing of many photos to be sure of a change, yet you say it only takes a fraction of the time looking at only the annotated photos to know that they are wrong?
On top of that, you are asking all the comment thread readers to believe you over me rather than to judge for themselves?
In the grand scheme of things, the annotations are only there to highlight what to look for in the un-annotated photos, so the absolute worst you could say, and only if you did spend the time to verify thus, that the places we have annotated have mis-recognised a fiduciary feature.
Perhaps you have misinterpreted the use of the colours?
They are to help the casual readerreconise what we have spent hours recognising as the same corresponding point on photos pre and post perihelion.
The point is to highlight all possible changes, but to allow the reader to judge for themselves.
For clarity, we could show the numerous other photos we have used that clarify how we can be sure of the fiduciary points, but it is way outside the scope of the blog post involved.
In a sense, I would love to hear specific criticisms about the annotations eg. “The yellow row of dots in the first photo doesn’t follow the same ridge” because conversations about specific mis-placement of points will help us in future blog posts – either in clarifying why we mark them in certain ways, or to avoid misleading.the viewer..
Hi Marco,
some of them corrspond, some don’t.
To my eyes, on the small scale, there seem to be so many changes, that it’s easier to find changes than to find the few unchanged features.
Privately, I’ve created an intuitive way to see the correspondence better. But it isn’t of a quality I’m ready to post. And I’ve simply not the time to complete it.
But I can give you an hint, how you can improve your dotting notation considerably, if you have more time available for this than me: Look for free morphing software. The results can be quite impressive.
I’ve also stereo vision capabilities, which allow to see a scene immediately in 3d, or to see the differences, when I look at a pair of images.
This helps feeding the morphing software.
But when the images barely match, I get headache after a few hours.
Hi Gerald,
Thank you for that – I can see now where you have gone wrong and in fact made me more confident of the annotations we have made!
The morphing software is only as good as the inputed fiduciary points are accurate to actual scale. It doesn’t take into account the concertina style horizontal movements and in fact the ongoing overall stretch of the subsurface. Which takes some of the exposed aggregate with it.
Hi Marco,
have fun with your confidence.
I’ve used the morphing software just to make the actual matches and 3d structure easier to perceive for untrained people.
It also helps to find flaws in the correlation.
But obviously you are too superior to require this kind of cross-checking.
You could also use SPICE data to check the change of perspective in the images, and a 3d model. But I’m sure you’ll handwave this away since you know the accurate 3d model by heart, and don’t require these “inaccurate” science and telemetry data.
You could also perform your own calculations to check your ideas. But that’s unnecessary, since you know, that you are right.
Here a crude morph, as ugly as it is in this incomplete state, to give an idea of the change of perspective between the two NavCam images:
https://imgur.com/a/Okkg6
Maybe it could motivate you, Marco, to create a better one.
Hi Gerald,
You say:
“I’ve used the morphing software just to make the actual matches and 3d structure easier to perceive for untrained people”
At least IanW16 laid bare his argument by linking to posts and annotated images. I have gone with my convictions and published with my real name and reputation on the line, nailing my colours to the mast etc.
If you are as expert and experienced with 3D as you say you are, you would at least have made a contribution to the call for contributions on this very blog. I don’t think you are convinced about anything except that I must be wrong because I am just an amateur citizen scientist.
At least link to a screenshot of what you are talking about. It can’t take that much more of your time than you are dedicating in trying to convince me that I am wrong.
Hi Marco,
it has nothing to do with whether you are an amateur or a professional.
The difference between an amateur and a professional is, whether they get or get not money for their job. I’ve been on either side several times, and sometimes simultaneously both, with exactly the same qualification in my profession.
Hi Gerald,
The morph you linked to has certainly helped me understand your thinking. To me it has verified the collapse on the left hand side and shown the straightening of the kinks in the overhang/cliff which is the most obvious change visible from OSIRIS even 60km distant.
However, the premises of what is causing the changes will colour the interpretation, and it is outside the scope of any visualisation software to decide on premises of interpretation. If you are looking for erosion you will perceive erosion. If you are looking for cliff collapse, you will see that. If you are looking for ongoing concertina style stretch, you will see that also.
It took a long time with many images to work out that the overhangs did collapse and cause those rock falls, and that the left one collapsed straight down without breaking and that there is concertina style horizontal displacement of boulders above the overhangs that have not eroded. Also, the right hand side cliff has not eroded and can be verified with a constant distance to its right of fiduciary boulders.
Hi Marco,
I’m not sure, whether the straightening of the kinks couldn’t mostly be an effect of perspective, too.
The morph still is too crude to make a clear decision.
I’m tending to assume no large change, until there doesn’t remain any reasonable alternative.
The surface is very rough on any scale, and many angles are rather acute, such that the change of the vantage point can cause the impression of a straightening.
There are many ways to go wrong. So it’s better to consider several alternative interpretation candidates, before tagging one of them as “evident”.
Maybe you find time, and fun, to play a bit with morphing software to check your ideas this way, and to present them to your audience. I’d recommend to provide more than one candidate, in order too be not too suggestive for one of the options.
I also produced several candidates, but posted only the one above, as an example. (In other examples I’ve sometimes gone wrong as I wasn’t fully concentrated, or easily saw additional correlations)
When refining the morph, you might eventually see, that the surface is more structured, than it appears in flat 2d images.
@Marco,
As I noted, in Fig. 8 of the paper I linked: “Bottom panel: new flow in Ash region, following the partial *collapse* of one active cliff. ”
That sounds like cliff collapse to me, partial or otherwise. Not my wording, but that of the authors. As I’ve said before, take it up with the authors, not me, I am merely reporting what they said.
Arguing about it here accomplishes nothing.
If anyone is interested to vote on twitter where the leading edge is best served with regards to comet nucleus changes:
https://twitter.com/MarcoParigi1/status/780994670851678208
I’ve noted the changes *thought* to have occured so that readers can compare for themselves between figure 8 from peer review or my Blog post explanation.
https://marcoparigi.blogspot.com.au/2016/09/67p-nucleus-changes-citizens-vs.html
Physical changes are the most fascinating and enigmatic things that citizens can hope to contribute to cometary science. I encourage everyone to have a look.
Most of the red and yellow dottings appear to be spurious. Actually perspective and illumination angle changed.
There may actually be some change, but the spurious annotation is confusing.
And I admit, that it’s really difficult to distinguish between changing shadows and perspective, and actual changes of the topography.
Hi Gerald,
Once you have a 3D mental map of the area in question, it is no longer difficult to tell the difference between changing shadows and perspective to identify the actual changes of the topography. That way, you too could “peer review” our annotations with confidence, rather than the tentative negativity based on instinctive sense impressions.
Hi Marco,
I’m sorry, but it appears to take me only a tiny fraction of the time you’re spending to see the severe flaws in your annotations.
So, it’s a waste of time for me to investigate this in more detail. I know, that this sounds arrogant and ignorant in your ears, but it’s the ugly truth.
And the professionals in this field are 10-times more experienced than me, at least.
If you are willing to get any serious attention of the science community, you’ll need to work an order of magnitude more carefully, at least.
Don’t think, that you are right when you think you see something. Be much more humble. Assume, that you are wrong, and thoroughly check for possible alternatives. That’s the only advice I can give you at the moment to overcome your pareidolia.
Your enthusiasm is sufficient to make discoveries, but your methods and selfishness need to be adjusted to a fertile level in order to be successful, eventually.
You might also be interested in reading about the birthday paradox, regarding being right with random claims.
https://en.wikipedia.org/wiki/Birthday_problem
@Gerald,
On further inspection, I agree. I don’t think we are even looking at the same ‘cliff’ here. I’m in the process of putting something together to show why. Takes a while, but I think I’ve spotted the error.
Thanks, Ian, for taking this.
I thought, the error is mainly due the unconsidered horizontal displacement of the camera, and due to the steeper sun, which illuminates previously shadowed areas, especially the remnants of an older rockfall. But you might even be right, that it’s a different cliff. I didn’t check for this latter option.
Hi ianw16
Are you going to post up this analysis of our error? I was holding off so that I could reply to that and everything else I haven’t responded to yet in this thread. It might be a waste of effort to answer beforehand if your analysis clarifies better where you’re going wrong.
Quotes from the J.B. Vincent et al. paper from section 3.3 onwards:
– “Outburst sources are not evenly distributed along this latitude.” [the sub solar latitude for this perihelion period].
This is because outbursts are related to the tensile force vectors of stretch that are physically stamped onto the comet (stretch theory isn’t mainstream or accepted by the Rosetta team). These tensile force features are deep rifts and delaminations that were catalogued on the stretch blog over a year ago and those same sites were responsible for emitting the the jets in this paper by J.B. Vincent et al.
Thus, as a whole, the jets appear to be related only loosely to the sub solar latitude because there’s a vast tract of solid, smooth material between the jets (Wosret) that wasn’t left with open wounds by the stretch process. Wosret is sitting right under the sub-solar latitude for the whole 3-month period of the study. It was thought that the reason the south pole was so flat and apparently eroded was precisely because Wosret is facing the sun directly at every perihelion. Now we’ve found there were no jets at all from this highly stratified yet smooth area. It follows that the vast amounts of expected erosion from Wosret simply didn’t occur.
“We observe some clustering in three main areas: (1) The Anhur-Aker boundary (big lobe), (2) the Anuket-Sobek boundary (big lobe), and (3) the Wosret-Maftet boundary (small lobe)”.
Anhur-Aker and Anuket-Sobek are at either end of the neck, which has an elongated cross-section. J.B. Vincent et al. refers to the Anuket-Sobek jets being correlated with ‘terraces’. These are actually west-to-east delaminations round the curved neck at this end. This was due to the long-axis tensile forces of stretch being directed around the future head lobe. The only choice was for the crust to delaminate either side of the proto-neck. I had already identified delaminations of the same width on the other side of the neck (with detailed translational matches). These Anuket-Sobek terraces are the same distance apart so I realised they were delaminations too. Subsequent analysis showed they also exhibit translational matches. We therefore concentrated on these terraces, that are really delaminations, for collapses, knowing they would be undercut more than the shadowing might suggest. Sure enough, we found what we expected to find because we were directed there by the exigences of the stretch process. Almost none of our discoveries are based on sudden chance findings explained by hastily constructed post-hoc mechanisms. It’s almost always the other way round: the mechanism of stretch directing us to findings that are hiding in plain sight. My comment above is a case in point. It’s regarding Marco’s rockfall and my collapsed massif sitting next to each other on the first terrace and dotted by J.B. Vincent et al. as outbursts 27 and 31 respectively. That comment is linked here because it might end up miles above this one with a run of exasperated replies between there and here.
https://blogs.esa.int/rosetta/2016/09/23/summer-fireworks-on-rosettas-comet/#comment-604526
@A. Cooper,
“Now we’ve found there were no jets at all from this highly stratified yet smooth area. It follows that the vast amounts of expected erosion from Wosret *simply didn’t occur.* ”
My emphasis.
Sorry, but where do they say that? As far as I can tell, they are talking about outbursts here, not regular outgassing. The point made in the paper is that many of these outbursts appear to be occurring at region boundaries; that is, where there is rough topography, such as cliffs and scarps. It is the point they are trying to make. The only way I can envisage (and it is mentioned in the paper) for an outburst to occur in a flat region, is for the heat to penetrate down to a pocket of supervolatile material. Therefore the pattern fits what they are suggesting; that many of these outbursts are due to mass wasting from cliffs and scarps, that expose icy material.
I would be amazed if there was no outgassing from the Wosret region, or indeed other flattish areas. I just wouldn’t expect to see too many outbursts from them.
It’s worth mentioning that a number of interesting papers have been released lately. Below are some of them. These are all free access:
Detection of exposed H2O ice on the nucleus of comet 67P/Churyumov-Gerasimenko
Barucci, M.A., et al.
https://arxiv.org/pdf/1609.00551.pdf
A porosity gradient in 67P/C-G nucleus suggested from CONSERT and SESAME-PP results: an interpretation based on new laboratory permittivity measurements of porous icy analogues.
Brouet, Y., et al.
https://mnras.oxfordjournals.org/content/early/2016/09/05/mnras.stw2151.full.pdf+html
A primordial origin for molecular oxygen in comets: A chemical kinetics study of the formation and survival of O2 ice from clouds to disks
Taquet, V., et al.
https://arxiv.org/pdf/1608.07130.pdf (not specifically about 67P)
Acceleration of Individual, Decimetre-sized Aggregates in the Lower Coma of Comet 67P/Churyumov-Gerasimenko
Agarwal, J., et al.
https://arxiv.org/pdf/1608.07933.pdf
Modeling the evolution of a comet subsurface: Implications for 67P/Churyumov-Gerasimenko
Guilbert-Lepoutre, A., et al.
https://mnras.oxfordjournals.org/content/early/2016/09/16/mnras.stw2371.full.pdf+html
Layering and internal structure of the comet 67P/Churymov-Gerasimenko as observed by ROSETTA
Massironi, M., et al
https://sait.oats.inaf.it/MSAIt870116/PDF/2016MmSAI..87..153E.pdf
Comet 67P/Churyumov-Gerasimenko preserved the pebbles that formed planetesimals
Fulle, M., et al.
https://mnras.oxfordjournals.org/content/early/2016/09/12/mnras.stw2299.full.pdf+html
Ion chemistry in the coma of comet 67P near perihelion
Fuselier, S.A., et al.
https://mnras.oxfordjournals.org/content/462/Suppl_1/S67.full.pdf+html
It seems that there is an upcoming issue of MNRAS that will be providing a number of papers based on the results presented at the 50th ESLAB meeting, a wee while back. Most of them (possibly all) appear to be free access. Worth keeping an eye out here:
https://mnras.oxfordjournals.org/content/462/Suppl_1.toc
The one thing that we know about comets from history is that they used to cause fear, even among powerful people who ruled territories larger than the surface of 67p. Much closer in time, as recently as this blog, we have had people arguing that their root cause must be powerful electric forces which make jets of roasted material shoot out at speeds of kilometres per second. The view that this article propagates, on the other hand, is of an icy ball encrusted in a crust full of inorganic and organic material, which leaks away, mostly gently, as it makes its daily rotations and seasonal orbits around the Sun.
I have some questions to entertain the blog’s writers after their constant work on communicating science effectively.
How dangerous will it be for an astronaut (Tintin comes to mind) to land on 67p and spend a couple of hours there? We have heard much about its stink, but is the concoction of chemicals corrosive enough to damage a spacesuit? Would the gentle emission of gases be felt as a breeze? Assuming one was there around local noon, what steps could be taken to prevent being thrown off by a sudden jet? Would one feel tremors beneath one’s feet, and get a sense of which way to run to prevent being knocked down by a falling boulder? How would one run without reaching escape velocity?
Please remember me when you sign the rights for the movie!
Warm regards,
Kamal
You would need to plug yourself somehow to the comet. You woudn’t feel neither the gravity nor a breeze, might be except a sudden outburst.
By plugging, you might cause an aoutburst.
Your main problem to deal with would likely be the dust all and everywhere, like for a diver in a muddy lake.
Boulders fall so slowly, that usually you should notice them, before they become a danger, and they might be soft. You may even be able to slow them down in time, unless they are hard and of a mass of more than a few tons, with their inertia as your major threat.
The roughness of the surface might be a risk for your spacesuit, not so much the chemistry. Another risk is the very low temperature of the comet’s subsurface. Your spacesuit needs to be made of a material which doesn’t fracture or gets brittle at temperatures near absolute zero, nor softens too much up to about 100°C, when exposed to direct sun.