Now that Rosetta has been able to safely approach Comet67P/Churyumov-Gerasimenko again following the active months around perihelion last August, scientists have been able to better image the southern hemisphere regions of the comet. This week the spacecraft is around 35 km distance from the nucleus, meaning that the OSIRIS narrow-angle camera can image the comet’s surface with a resolution of around 80 cm/pixel.
This has allowed OSIRIS scientists to update their maps of previously undefined regions on the comet. Three new regions have been defined in recent months: Bes, Geb and Neith.
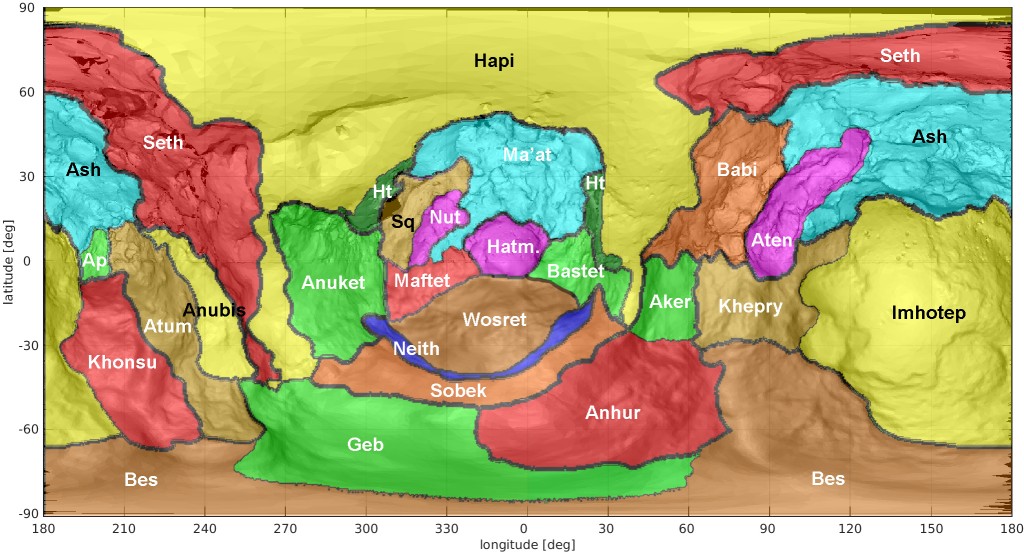
Regional map of Comet 67P/C-G identifying the approximate boundaries of the newly defined southern hemisphere regions in context with those already known. Credit: ESA/Rosetta/OSIRIS/El-Maarry et al (2016, in preparation)
Following the naming conventions of the other 23 regions, these too take the names of Egyptian deities.
“The southern hemisphere regions also use the same naming practice of using male deities for the comet’s large lobe (or body) and female ones for the regions on the small lobe (or head), while the neck regions – Hapi in the northern hemisphere and Sobek in the southern hemisphere – represent gods of the Nile river,” explains Ramy El-Maarry from the University of Bern, part of the team mapping the surface of the nucleus.
“The southern hemisphere looks ‘flattened out’ in comparison to the north yet we can still see large cliffs in the south and these include the Neith region on the small lobe (mirroring Hathor in the north), and Geb and Anhur on the large lobe (mirroring Seth).”
Ramy notes that there are seven regions defined in the south compared to 19 in the north.
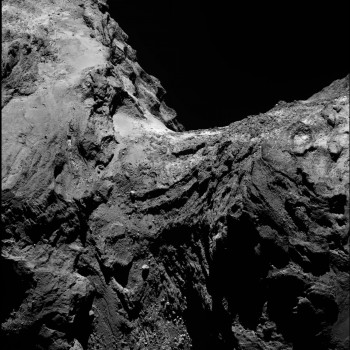
OSIRIS narrow-angle camera image taken on 30 January 2016 from a distance of 62 km. The image scale is 1.1 m/pixel. Credits: ESA/Rosetta/MPS for OSIRIS Team MPS/UPD/LAM/IAA/SSO/INTA/UPM/DASP/IDA
“We observe less variation in the southern hemisphere due to the lack of smooth deposits, dust cover and large depressions there,” he says. “In this regards, there are two important benefits: the first is that we can study the actual surface of the nucleus in more detail without the dust cover, and secondly, we have less names to memorise!”
The team need more images at high resolution of the southern hemisphere regions in particular before finalising a more detailed map with exact boundaries between the geomorphologically distinct regions.
While this work is ongoing, this interim map provides a useful guide to support many of the new images published via the OSIRIS image of the day website that show these regions.
For example, in the image shown above, the familiar smooth ‘neck’ region defining Hapi is seen close to the top of the image with small portions of Seth, Anubis and Atum to the top left. In the foreground, ‘below’ Hapi, Geb dominates, with a portion of Bes to the left. On the neck, Geb transitions into Sobek, before encountering Neith and then Wosret to the far right.
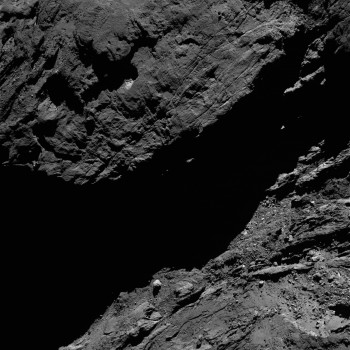
OSIRIS narrow-angle camera image taken on 7 February 2016 from a distance of 47.5 km. The image scale is 0.86 m/pixel. Credits: ESA/Rosetta/MPS for OSIRIS Team MPS/UPD/LAM/IAA/SSO/INTA/UPM/DASP/IDA
In the second example, right, Wosret is seen at the top of the image, with Anhur to the right in the lower part. Anhur transitions into Geb towards the lower left, while Sobek is in the shadowed portion of the comet in this view.
Bookmark the OSIRIS image of the day archive for more great new views as Rosetta continues to approach the comet.




Discussion: 20 comments
Hi Emily or Claudia,
I wonder if it is possible to get the updated map colors and names superimposed on the following best-lit Osiris and/or Nav cam views, or even better upon your 3D model but make it high res jpegs for ease to see?
Something like:
North Pole elevation
South Pole elevation
4 seperate views around the equator
I am trying to accurately paint the colors on my 3d model.
Thanks!
Hello Ramcomet
Apologies for self-promoting, but you can view 67P with applied texture on my website (https://space.frieger.com/asteroids/comets/67P-Churyumov-Gerasimenko) – I’ve just finished uploading this region map.
Names get distorted in complex areas, but otherwise it fits quite well.
Hi Greg!
Thanks, sure it will be very helpful. Looks like I need to download WebGL to see regions, so I will work on that.
Thanks again!
From one of the ESLAB abstracts:
“The comet’s southern hemisphere shows a lack of spectrally red regions associated to the absence of wide spread smooth or dust covered terrains. Several local, bright and spectrally blue patches have been identified on the nucleus and attributed to exposed water ice on the surface. In particular we observed big (> 1500 m2) bright ice rich areas in the southern hemisphere which completely sublimated in a few weeks. We see evidence of diurnal and seasonal color variations associated with sublimation and recondensation processes of volatiles.”
Sonia Fornasier et al.
https://www.congrexprojects.com/docs/default-source/16a07_doc/16a07_abstract-book_20160222.pdf?sfvrsn=2
Page 44.
Ianw16
Thanks, I skimmed right through and read about half of the abstracts. I thought everything seemed to be slowing down but as far as I can tell, a lot of this may be new work because many abstracts mention perihelion and after. I think the slew of October papers were too early for that time period- but you probably know better.
So do you think some of these conference abstracts will be preludes to published papers like many AGU presentations?
Among some rather jarring assertions for stretch theorists (all four of us) to take in, these two sentences on page 45 sum it up. Sentence one: disarmingly confident assertion. Sentence 2: the very reason sentence one is incorrect.
“These very diverse erosional forms have been created by cometary activity. This diversity seems to defy all (simple) models describing the loss of dusty material due to sublimating ice(s).”
From this abstract:
Snowball – Icy Dirtball – Rosetta
Horst Uwe Keller et al.
Universität Braunschweig (Germany)
@A. Cooper
“So do you think some of these conference abstracts will be preludes to published papers like many AGU presentations?”
Almost certainly, based on previous conference abstracts I’ve read. It’s a good way of keeping up with the current thinking, and results.
Otherwise, as you say, we have to wait for the published papers. Unfortunately, but understandably, they can take a long time to be written, reviewed, accepted and then published. So most of what we see is at least a few months old, often quite a bit more.
Ianw 16 re ESLAB abstracts.
Thanks for the link Ian, lot of interesting details in the abstract.
Ianw16
Re page 45 of your link (Dirty snowball – icy Dirt ball)
Appearances that on earth would be called mountains and deserts. These very diverse erosional forms have been created by comet activity. This diversity seems to defy all ( simple) models describing dusty material due to sublimating ices.
I guess its not a surprise that sublimation cant be a catch all, and I look forward to some more detailed explanations of what is going on.
Regards
@Dave
“I guess its not a surprise that sublimation cant be a catch all, and I look forward to some more detailed explanations of what is going on.”
Whatever is going on will involve the materials we know are abundant on, or in, the comet; that is dust, organics and ice. Then you can throw in heat from the Sun, and possible stress induced events due to the shape, rotational period, axial tilt etc.
I suspect there will be a number of groups running models based on what has been discovered at this comet.
Some have already been run, as I linked to elsewhere:
“Sublimation of water ice mixed with silicates and tholins: Evolution of surface texture and reflectance spectra, with implications for comets”
Poch et al.
https://www.sciencedirect.com/science/article/pii/S0019103515005709 (paywalled).
Ianw16,
Thank you! What I could see of this abstract and images is fascinating to me.
Also in related posts at bottom of page:
https://www.sciencedirect.com/science/article/pii/S0019103515005163
Recreating comet conditions and material evolution in a lab chamber, and actually getting to see little slabs of mantle blowing off the surface, matching real processes on the real comet is pretty darn gratifying!
I noticed colors and darknesses of the many different post process or in situ sample photos. I cannot see the captions or read the paper but wild-guessing the blacker ones might have been hit with more UV resulting in much blacker color (PAHs?) like the charcoal color of 67 P. Meanwhile the lighter ones, yellow and reds, might resemble some results of processes on Pluto and Charon.
@Ramcomet,
Yes, a very interesting paper. There was also a related paper by the same authors (again, unfortunately paywalled):
https://www.sciencedirect.com/science/article/pii/S0019103515005163
They used different particle sizes and mixing methods. Some of the ice particles had the tholins within them (intra mixture), and some just coated with them (inter mixture).
From the conclusions:
“The mixing mode of the ice with the tholins appears to play a role in the sintering of the ice particles below the mantle. The ice of an inter-mixture sample sinters much more efficiently than the ice of an intra-mixture. The mantle of tholins produced from an inter-mixture favors the recondensation of the watervapor between the ice particles.”
Amazing images, as usual from this spectacular mission. Thanks for the new map. One feature I particularly like in the second Osiris image is what looks like a bright inclusion in the surface (above and to the left of the middle of the image). It doesn’t look like a difference in slope or lighting, it looks like a high albedo patch. Interesting!
Hi Rosetta Team,
I have printed my own 3d models, one of them in white, so I can paint the colors directly on it. But I have some trouble visualizing the accurate borders, especially at the neck, arctic and antarctic regions with this type of regional map.
So I am really hoping for high resolution color maps on at least the top, side, front and back Views of 67P as you have done in lower resolution before.
Do you plan on supplying these easier to see maps soon?
Thanks so much!
If the layers are sedimentary strata, the image
https://www.esa.int/var/esa/storage/images/esa_multimedia/images/2016/02/comet_on_30_january_2016_osiris_narrow-angle_camera/15792656-1-eng-GB/Comet_on_30_January_2016_OSIRIS_narrow-angle_camera.jpg
shows an interesting stratigraphy. The strata at much of the neck don’t show a clear discontinuity as would be expected for a merger of two bodies, but instead a saddle-like structure. This may indicate a sedimentation of part of the neck region after contact.
Below the “saddle strata” there appears to be a clear discontinuity on top of older layers belonging to the old separate bodies, which appear to have been eroded partially, before sedimentation of the saddle.
— just by a short glance —
The neck region seems to bear some of the keys to formation history.
Hi Gerald,
You are way too sympathetic to CB theory. These structures are completely incompatible with CB. I’d have a better chance of fitting a camel through the eye of a needle. These strata must have once been flat and concentric due to Steno’s law, and now they are buckled and delaminated while still showing parallel matching features. This in the same way strata on Earth fold under geologic stress.
Gerald, Marco: The Osiris picture taken on 27 January is from a similar but slightly different angle, reveal more of the region inside the angle formed by the features seen going vertical and horizontal. Put together the two images might give better information.
Thanks Emily
But any chance of the traditional shape model version too? I think Neith and Bes are especially hard to visualise in this projection.
Agree, Andrew!
Hi Emily,
We could really use that around here!
Many Thanks in advance!
This Blog is still wonderful.
Hi Emily,
Any word on when more standard views of the color map may become available?