Extreme thermal stresses experienced by a comet as it orbits around the Sun could explain the extensive fracturing thought to drive its long-term surface erosion, say Rosetta scientists analysing high-resolution images of Comet 67P/Churyumov-Gerasimenko’s surface.
The study, which is published online in the journal Geophysical Research Letters, is based on images taken between 6 August 2014 – when Rosetta first arrived at the comet – and 1 March 2015, and includes detailed images acquired from between just 8 and 18 km from the comet’s surface.
Ramy’s team identified three distinct settings in which the fractures occur: networks of long narrow fractures, fractures on cliffs and fractured boulders. In addition, several unique features were identified: the parallel fractures running across Hathor’s 900 m-high cliffs, an isolated 500 metre-long crevice in the Anuket region of the comet’s neck, and a 200 m-long complex crack system in Aker on the large lobe.
“The fractures show a variety of morphologies and occur all over the surface and at all scales: they are found in the towering 900 m-high cliffs of Hathor right down to the surfaces of boulders a few metres across,” describes lead author M. Ramy El-Maarry from the University of Bern.
The most prevalent setting appears to be networks of narrow fractures that extend for a few metres to 250 m in length, typically on relatively flat surfaces. Interestingly, in some locations, the fractures appear to cross cut each other in polygonal patterns at angles of 90º – on Earth and Mars this is often an indicator of ice that has contracted below the surface.
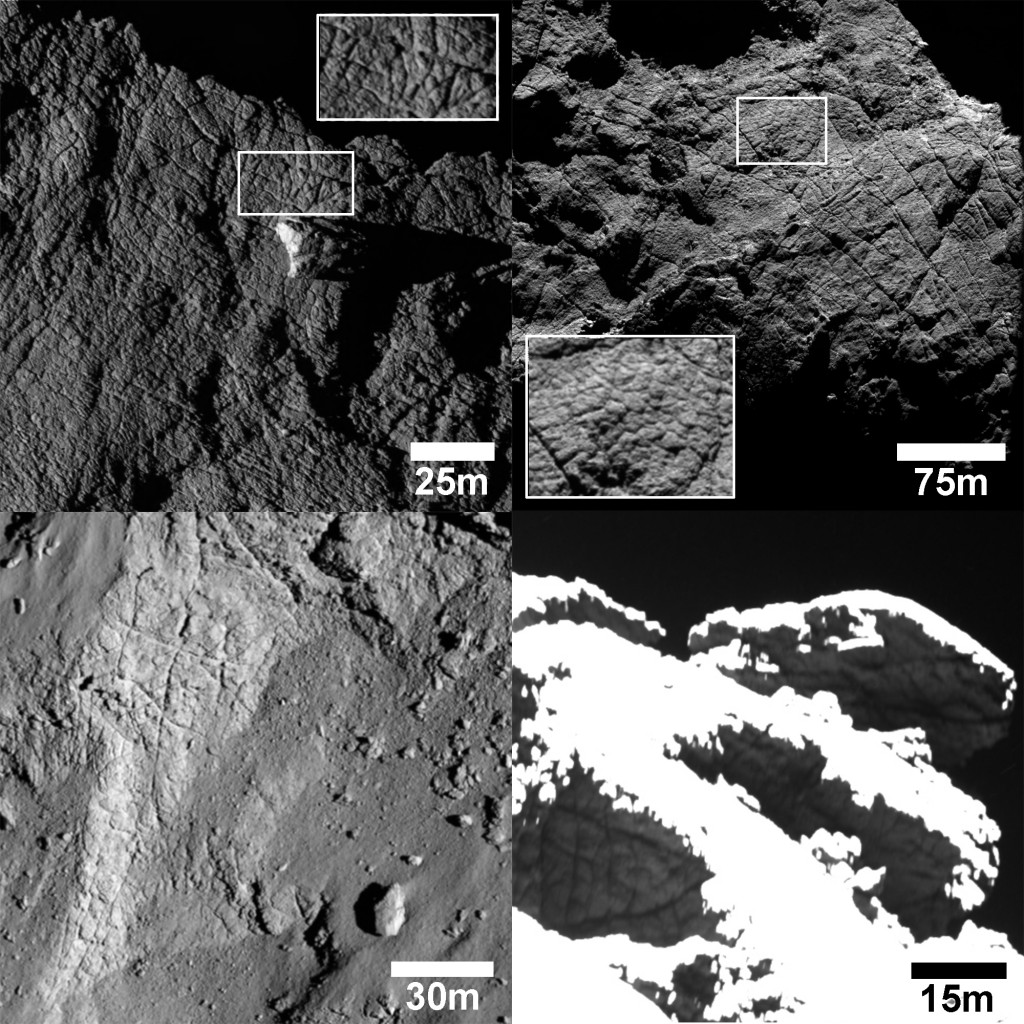
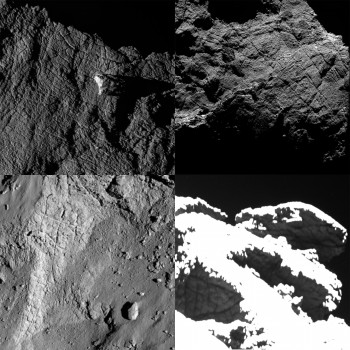
The variety of fracture networks found on Comet 67P/C-G, with an indication of physical scales. The top left image shows polygonal fractures on the edge of the Apis region, on the comet large lobe. The zoomed-in insert shows that the patterns are composed of irregular 2–5 meters-wide polygons. The top right image shows a pervasively fractured region at the edge of the Atum region, close to the comet’s neck. Fractures vary greatly in length, with the longest visible one measuring about 250 m. Within this irregular pattern, a more regular pattern of 2–6 m-wide polygons is also visible, as shown in the insert. The bottom left image shows a regular patterns of fractures at the edge of the Nut region, a narrow, elongated depression on the small comet lobe. Patterns of 15 m-wide polygons with orthogonal fracture intersections are also visible. The bottom right image shows polygonal patterns on the edge the ridge separating the Anubis/Atum regions from Ash and Seth, on the large comet lobe The image has been overexposed to highlight the shadowed features, and smaller polygons with sizes of 2–5 m are also visible. A non-annotated version of the image is provided below. Credits: ESA/Rosetta/MPS for OSIRIS Team MPS/UPD/LAM/IAA/SSO/INTA/UPM/DASP/IDA
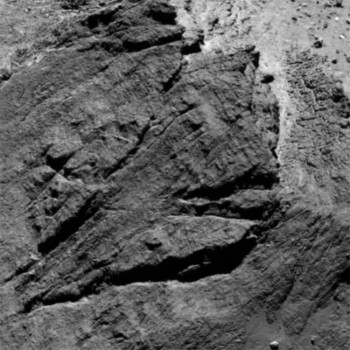
Another family of cross-cutting fractures is observed on cliff faces, such as in the Seth region on the comet’s large lobe, with debris deposits littering their bases. Fractured cliff faces were also observed at Abydos, the final landing site of Philae on the small lobe, as recorded in images from the lander. The fact that the fractures cut across each other in different directions suggests that the stress direction changes over time.
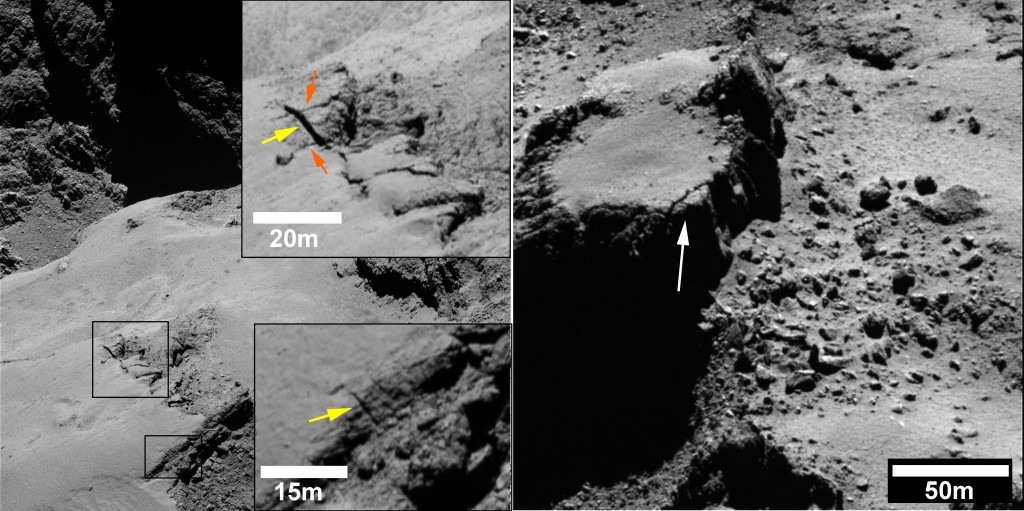
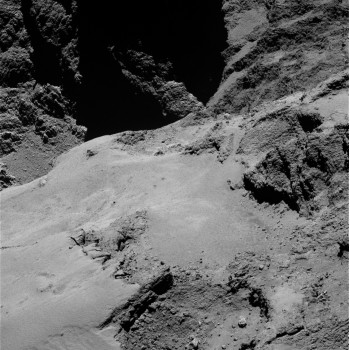
Fractures found on cliffs on Comet 67P/C-G. The large image on the left shows the Ash region (located on the large comet lobe) in the foreground and the regions of Hathor and Anuket (both on the comet’s neck), in the background. The two boxes highlight two small portions of the comet surface, which are shown in greater detail in the two close-ups, with an indication of the physical scale. The top close-up shows a fractured scarp and what appears to be a new fracture (indicated with a yellow arrow) cross-cutting two older fractures (orange arrows). The new fracture is 100–125 cm-wide and is expected to lead to ‘mass-wasting’ of the fractured scarp. The bottom close-up shows another small fracture (indicated with a yellow arrow) that appears to cut though the scarp edge and the smooth coating on the top, which is a morphologic characteristic of the Ash region. The image on the right shows a portion of the Seth region exhibiting a similarly fractured scarp (indicated with a white arrow) and a debris field in at the foot of the cliff suggesting a progressive process of ‘mass-wasting’. Non annotated versions of the individual images are provided below. Credits: ESA/Rosetta/MPS for OSIRIS Team MPS/UPD/LAM/IAA/SSO/INTA/UPM/DASP/IDA
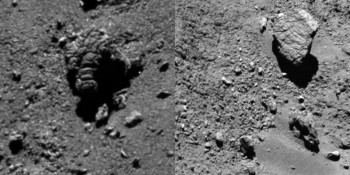
At the smallest scale, fractures are observed on boulders (in this study, boulders 20-60 m wide were analysed). In some cases it is clear that the fractures run through the boulders, pervasively fracturing them, while other fractures appear confined to the boulder’s surfaces. Taken together, the fracturing points to an erosional sequence leading to the boulders’ eventual fragmentation.
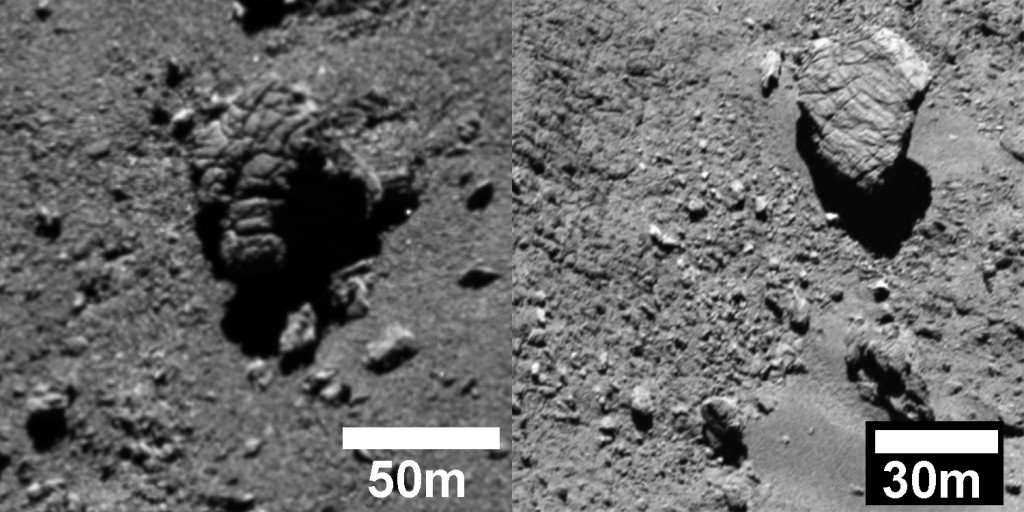
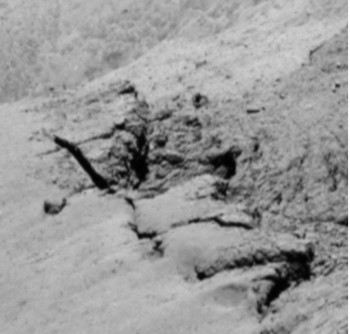
These two images show two fractured boulders found in the Imhotep (left) and Atum (right) regions, respectively. Fracturing in the Imhotep boulder is so pervasive it has led to fragmentation of the 60 m-wide boulder. An indication of the physical scale is provided; a non-annotated version of the image is available below. Credits: ESA/Rosetta/MPS for OSIRIS Team MPS/UPD/LAM/IAA/SSO/INTA/UPM/DASP/IDA
Scientists think that the majority of these fracture patterns are most likely linked to the thermal history of the comet and result from stresses that stretch the comet’s surface apart. On Earth and Mars at least, these ‘tensile’ fractures can develop through several common processes: loss of volatile materials, thermal contraction or contraction and expansion cycles, and tectonic processes.
In addition to throwing off volatile materials as they near the Sun, comets are known to undergo high fluctuations in surface and subsurface temperature on daily and seasonal timeframes. This continuous thermal ‘shock’ leads to weakening or “fatigue” of the surface both on the short term due to daily heating cycles, and on the long term as the seasons change along the comet’s 6.5 year orbit around the Sun.
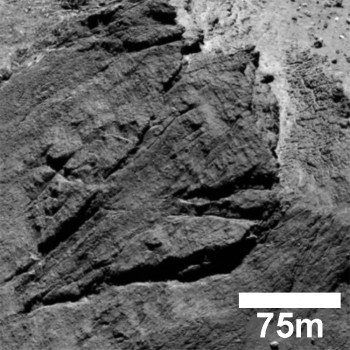
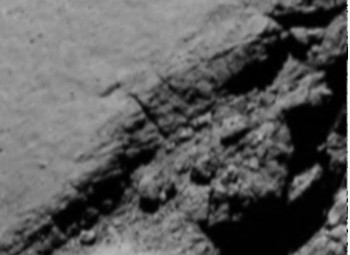
A 200-m complex fracture system in the Aker region, on the comet large lobe. This is an isolated feature in the context of the surrounding morphology. An indication of the physical scale is provided; a non-annotated version of the image is available below. Credits: ESA/Rosetta/MPS for OSIRIS Team MPS/UPD/LAM/IAA/SSO/INTA/UPM/DASP/IDA
“But the presence of fractures in different settings, in addition to the isolated fractures in Anuket and Aker, suggests that other mechanisms may also be at work,” comments Ramy. “For example, perhaps mechanical forces related to the comet’s rotation or orbit around the Sun are responsible for the crack in Anuket, while the fractured cliffs of Hathor could have resulted from the comet’s formation, perhaps when two smaller cometisimals collided.”
Regardless of the origin of individual fracture systems, it is clear that fracturing plays an important role in the evolution of the comet’s surface.
Fractures observed in cliffs, with debris observed at their bases, imply that this phenomenon represents the first stage in the overall ‘mass-wasting’ of the comet: the cliff top is weakened and a landslide-type event ensues.
But, over long periods this process would act to erode the surface and flatten the landscape. The fact that there are many rough terrains on the comet suggests that it has either not gone through very many erosional cycles or other processes are acting against this to roughen the surface, such as explosive jet activity.
“Monitoring for changes in these fracture systems after the current perihelion phase, and running models to simulate the evolution of the comet over time, will enable us to test our various hypotheses for fracture formation,” adds Ramy.
—
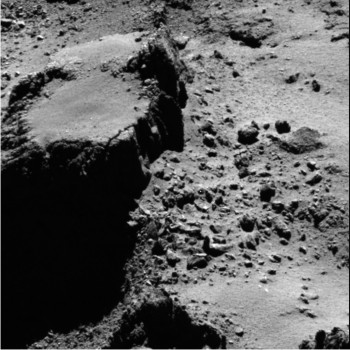
Non-annotated versions of the images are provided below:



Discussion: 31 comments
The second photo down in this blog post has a caption that refers to the right hand image as, “The image on the right shows another portion of the Ash region…”
This feature is nearly a kilometre away from Ash, in Seth, and is about 200 metres from the Seth/Hapi border. The actual border, as defined by the top of the ridge or cliff that drops down into Hapi is just visible at the bottom of the photo. It’s the dark shadow. The feature described can be seen in the following photo, viewed from the opposite direction. It shows it located on the comet as described above:
https://imagearchives.esac.esa.int/picture.php?/10547/category/67
The cliff feature is at top-right, near the large shadowed area which itself is in Hapi. You can see Hapi extending in front of the shadow or below it in the photo. Just below the first obvious dip in the large shadow, you can see a small, dark, frilly feature. That is part of the Hapi/Seth cliff edge. Its tapered left hand end (that’s straighter) is the same shadowed line at the bottom of the photo in question from this blog post.
The reason for the appearance of this cliff feature, with the white arrow is that it tore away from the shadowed line at the bottom of the photo. It then slid back 200 metres along the shallow trough you can see at its base. The scree in the trough was scoured out by the backward movement. The reason the two torn edges aren’t parallel is that the left hand side of the cliff sprung back (in relative terms) more than the right hand side. This is because there was less tensile force along the exposed right hand edge.
This feature is at one end of a nearly one-kilometre-wide slippage of crust along the Seth/Hapi border. This slippage, including the cliff feature in this photo, and many other obviously slipped features is described in detail in the following blog post (scroll to the bottom; heading ‘Signature 6’).
https://scute1133site.wordpress.com/2015/08/12/67pchuryumov-gerasimenko-a-single-body-thats-been-stretched-part-26/
This slippage process can be ascertained only when this feature is observed in the context of the cometary features that surround it (including those on the head directly above it). When looked at in isolation it just looks like yet another eroded scarp.
For a full explanation of the process at play here, it’s necessary to read the rest of the post.
I meant to identify the position of the white-arrowed cliff in the photo I linked, which was the most important thing! If you look below the dark frill, you see a slightly lighter block of material that’s notionally rectangular, with a small chunk missing from its bottom-right corner. The rectangle is fairly near to vertical as we see it. It has two darker bits either side of its middle area. The top end of the rectangle is the cliff-top that is arrowed white in the photo in question. The actual cliff face is out of sight because we are viewing the rectangular feature from the opposite end.
Dear A.Cooper,
Many thanks for your comment.
Indeed, you are correct, the right frame in the second image of this post shows a portion of Seth, not Ash (the caption has been corrected now).
I double checked with Ramy El Maarry, he confirmed this is a typo on the paper and thanks you for spotting that.
Best wishes
I see so many examples of thermodynamics driving the thought processes of these ideas. Ice contracting below the surface, previous hot/cold stresses… all which require assumptions from what we cannot see. I can come up with any theory and use historical assumptions as evidence. Why would the large lobe of 67P possess erosion all fracturing the same as a surface boulder if internal properties were most significant? Is there ice contracting (even though 67P’s heat is increasing) in the boulder the same way as huge areas on 67P or could they be resembling because both are exposed to the same external environment and, thus, the same external erosion all process?
Thank you for sharing another excellent el Maarry, et al, paper with us.
As we have observed from the Navcam imagery received, there are multiple families of fractures on the surface of 67P/C-G. These multiple patterns suggest that one family is created first by differences in composition and texture resulting from the accretionary processes which assembled the comet. Another family of fracture patterns is created by stress-relief due to changes in the volume of rock due to loss of volatiles and ices, as well as thermal stress from solar heating. Without out the relief of internal stresses the comet body would experience major and catastrophic material failures resulting in the disruption of the comet nucleus. A major cosmic kerblooie, so to speak, would result.
During the evolution of the comet surface, these fractures and textures and modified and emphasized by weathering and erosional processes. . It is noted that many of the fractured surfaces are dust- and rubble-free, which suggests that there is a significant non-point source of gas outflow from the fracture systems, which compliments the point-source gas outflow from the active pits and vents.
–Bill
Andy? Marco?
Ramy was doing fine until he supposed the fractures in Hathor “could have resulted from the comet’s formation, perhaps when two smaller cometisimals collided.”
Really? Why are they still building Pink Floyd’s “The Wall”?
The rest of the presentation is stellar. Thanks to the team!!!
Hi Ramcomet,
Hathor has been suggested as a “shattercone” type feature with no evidence other than the lines being reminiscent of lines evident in asteroids that have had obvious violent impact. This contrasts with the idea that a contact binary requires a very gentle impact to make and keep contact without destruction.
With stretch theory:
1) the lines are obvious as dykes generated by explosively gasifying liquids pushing through a small gap between lobes from the incipient neck to the head/body fracture before shear and stretch. A big clue is the way they radiate from the neck.
2)A lot of the cracks on the neck are zones of continuing stretch. Measurements between features either side of a crack, before and after perihelion, would definitively prove ongoing stretch. Also the distance between OSIRIS and CONSERT favoured locations for Philae may be an indication of ongoing stretch. Thus the placement of CONSERT data on the model has not taken into account that stretch has made the model inaccurate in the stretch direction, and the points are a matter of 50metres out or so.
Hi Marco, thanks for mentioning the shatter cones.
Great to see the authors of the paper getting to the same conclusion regarding Hathor, I’ve been considering a few months ago:
https://blogs.esa.int/rosetta/2015/05/22/cometwatch-closeup-looming-over-aten/#comment-467358
Hi Ramcomet
I think you’re right to question the Hathor cliff ‘fractures’ as being produced by a collision. I was going to do so but thought the other issue (see comment above) should be addressed first.
I think these vertical lines on the neck are dykes produced from the shearing process. Can’t be as sure about that as I am about the actual shear but nothing has been published on the Rosetta blog or in the literature to counter the circumstantial evidence for dykes.
These supposed fractures are much wider and ‘fluffier’ than any other fracture system on the comet. When viewed close-up, they resemble conduits formed by running hot water through a block of ice. They don’t look like clean, sharp-edged fractures like all the others and they appear to be as wide as they are deep. Some look as if they may be of a roughly square cross section. That would be consistent with the escaping gases scouring conduits in the material between two comparatively resilient fracture planes (when the head was seated on the body according to stretch theory). To see all these features, try scanning along the head lobe rim in this photo:
https://apod.nasa.gov/apod/ap141223.html
The paper is paywalled but I checked the link to the supplementary pages and found the photo they use for what the authors say are fractures at Hathor. If you look at the left hand side of the photo, you see the longest fracture/dyke running up to the left of a finger-like bump in the cliff. It then disappears at the rim but is extrapolated to a hole just above the rim.
I believe that hole is the outlet to a collateral dyke that found its way through from the main dyke (the long green line) that itself emerged at the rim. This would be consistent with the gases from the main dyke finding mini conduits at lower pressure near the suface, i.e. a lower pressure than the overloaded main outlet. That’s what happens with volcanos. The photo is on this supplementary page:
https://onlinelibrary.wiley.com/store/10.1002/2015GL064500/asset/supinfo/grl53164-sup-0003-Supplementary.doc?v=1&s=231cea9104302a4ac348a7a63ea958640d4d15da
There are also two more short lines to the right of the long one with the collateral dyke and one of those also has a pin-prick hole above it (not visible due to white-out in their photo). I think that’s a collateral dyke running near the surface too. It’s collateral to a longer dyke that runs up the right hand side of the bump or ‘finger’, through the two shadowed areas. This supposed dyke isn’t shown as a green fracture line in their photo. It has three fluted offshoots at the top (four if you include the invisible collateral channel). One of the three is shown as a short, green line running up to the head rim. The other two bend round suddenly to exit at 90° to the main dyke. One of these two short, right-angled sections is shown by the authors but is thought to be a stratum layer.
The two right-angled sections are in fact fluted and along with more flutes below them, they create a double fan shape. This is because the double fan shape can be seen as a slurry outlet and can be linked to the two slurry piles directly below on the body. There are thousands of words and a dozens of annotated photos on the stretch theory blog just devoted to this tiny area. From parts 1,5,7 and 8.
Capta ate it; retry.
If you are interested in why 67P is duck shaped, a précis of a very interesting paper here:
https://scitation.aip.org/content/aip/magazine/physicstoday/article/68/8/10.1063/PT.3.2867;jsessionid=nbpsd1spwmpp.x-aip-live-03
With the full paper here:
https://www.sciencemag.org/content/348/6241/1355
The authors show, using a very sophisticated simulation, that there are realistic impact regimes which lead to bi-lobed comets – ducks in fact.
Of course this does not show 67P formed that way; but does add weight to that being credible. (It always seems rather unlikely, intuitively, to me. But I learnt to be wary of intuition in such matters long ago!)
Hi Harvey,
Yes. The simulation is very sophisticated, and yes, they do come up with a duck shape in one of their simulation runs. The real issue for me is two-fold –
1) initial conditions
And
2) Actual observable evidence.
For 1) the initial conditions, which is two very slow relative velocity moving bodies that are similar in size, me and A Cooper have argued ad nauseum that this is virtually inconceivable without future destructive collisions given the probability distribution of bodies and masses required.
For 2) they have ignored morphological evidence from Rosetta. They could have made precisely the same conclusion from the same models with vastly different surface features on 67P than that observed from the space probe.
The comet features are a puzzle that is completely resolvable with stretch theory, and an enigmatic jumble of possibilities without stretch theory.
The probability of the right initial conditions being met is exactly why I found it an intuitively worrying approach. On the other hand it did have a very long time, and an awful lot of potential ‘trials’, so I remain agnostic/bit sceptical about it. It needs some attempt at a statistical analysis of their likelyhood.
But I have easily as many problems with the ‘stretch’ theory. I’m afraid it comes *nowhere near* ‘completely resolvable’ to me.
The jury will be out for a long time on this. Post perihelion close observation should be very interesting.
I don’t share the scepticism about possible binaries.
Look at a protoplanetary disk:
https://en.wikipedia.org/wiki/Protoplanetary_disk
Due to friction either by gas or by early collisions of dust grains, the velocity vectors of nearby grains are almost identical, leading to low relative velocities.
Take the Saturnian rings as another example.
As soon as you get outside the Roche limit of the star (that’s in contrast to most of the Saturn rings), and the density of the disk is sufficiently high, the grains start to accrete to larger bodies.
This process continues until the system gets too rarified, or larger bodies, like planets, disturb the system.
Hence it’s quite natural, that the last accretion step for small bodies can be contact binaries.
So, Marco, your nausea about 1) isn’t justified in my eyes. It’s instead based on the presumtive stretch idea, and avoidance of an unprejudiced understanding of the processes in an a protoplanetary disk.
Ad Marco’s 2) : That’s a mix of actual observations, and stretch-prejudiced pareidolia. Therefore it’s hard to tell, whether there is a grain of truth in the stretch idea or none at all.
Gerald,
I am glad you have made your position so clear, because we will look back on this conversation this time next year when the clear criteria we had set out will be resolved.
With regards to 1), it is really in response to Holger’s own statistical collision analysis in his paper supporting contact binary, and the “collisional problem” brought up in various seminars. Mathematically it doesn’t stack up without considerable fudges, despite “accretion disk” ballpark imaginings.
With regards to 2) I can tell you that I am being very self critical as well as critically looking at A. Coopers evidence as well (because very few others are looking at it at all) but I guess you only have my word for it unless you specifically look at the evidence yourself and tell me precisely where you think the pareidolia is a factor. You will see by my responses to any specific criticism that I am looking at it critically and skeptically.
Hi Marco, the pareidolia is a real problem; I’ve experienced it myself several times. As soon as one’s brain thinks it does see something in a random pattern, it’s hard to get out; think of the Rorschach (inkblot) tests. Even if you rationally know what it is, you see something else:
https://en.wikipedia.org/wiki/Rorschach_test
With a lot of practising I’ve learned to detect and overcome this trap in most cases.
One means to debunk one’s own pareidolia is to think logically and formally.
With the first well-resolved NavCam images, one of my first impressions has been two halves of a broken egg, as well. But after a few hours of intense analysis I’ve discarded is as an optical illusion (“pareidolia”), since my brain wanted to see something known in something unknown. In an honest statistical comparison of the two lobes, there are too many mismatches to be consistent with a split of an initially roundish object, regarding the overall diversity, i.e. similarity of features, of the surface of the object.
I could do this in detail, and show A.Cooper’s comparisons as non-unique or non-significant, in principle, but I doubt, that I can spend the necessary time. I’m too busy with more important projects.
Regarding 1) I’m not really totally unexperienced in maths. So I know, that there are a huge number of possible mathematical models and theories which could be applied.
One thing is certainly clear: Assuming a system of purely randomly moving objects, in a statistical sense, in the protoplanetary disk, near the end of the formation of 67P, is “utterly” wrong. The disk must have been rather well-ordered. Otherwise the comet wouldn’t have formed at all due to the frequent high-speed collisions, as you’re applying to the contact binary hypothesis.
I guess, that the OSIRIS team simply hadn’t enough time yet to do the proper modelling in all necessary detail.
Writing and running the necessary software is rather time consuming.
re “mathematically”: An important progress from a subjective, and more or less opinion-based collection of “evidence” to an objective and reproducible evidence, would be a formal definition of matchings in the sense of the stretch hypothesis.
Only on such a definition you can actually do statistics and decide, whether there is something evident.
Hi Gerald,
I understand the principles of Rorschach inkblot tests and the human tendency to see patterns when there provably are not any.
My first instinct was to research how partial fingerprint matches are statistically verified. The problem is that all statistically verifiable matching systems are experiment based – a lot of fingerprints with known source fingers to develop a statistical baseline. Ie. We would need thousands of comets with known sources of “comet prints” to check on. This is a clear dead end. It is like trying to prove continental drift with matching mineral types in sequential areas. There is no way to statistically verify that two areas on Earth were once joined just by measuring points between consecutive matching mineral types between the two coasts that may have once been joined. However, in hindsight, there should have been a point where it just could not have been a coincidence anymore, statistically speaking. It would have been fuzzy, in as much as most statisticians would still doubt perhaps 10 matching measurements/mineral types, but 100 should have made them consider it as proven, although history showed that the idea of contnental drift was dismissed for decades despite a mountain of evidence in its favour. One could have said that a consensus of scientists at the time had reverse pareidolia. That is they dismissed real evidence because it contradicted what they thought they knew about the mechanisms of Earths geology, and thus couldn’t model a mechanism that could corroborate the evidence.
Thus the formal definition of matchings would theoretically require the knowledge of the answer to the question of whether the comet stretched just to get a single statistical point, which is altogether unrealistic.
A.Cooper has found point after point counted to over a hundred, most of which I have inspected objectively which match from head to body. NOTE WELL – These do not at all look like matches on a first and second glance. It takes me several sessions just in one locale to recognise particular points from different angles and lighting that are in the target area for possible matches. Then I am checking the actual distance and direction from previous putative matches in 3 dimensions. Areas on the head and lobe that look nothing like matches just by looking at the 2D photos, mysteriously have points on them that OBJECTIVELY have distances and 3d directions that sequentially match from head to body.
I am claiming that it is in fact our tendency to see a lack of a match when there actually is one hiding in the shadows and lighting of photos taken at random angles from the match. The reason the lighting is ALWAYS different between body and head match is that there is rotation as well as translation between them further confusing our pattern recognition systems which are tuned to recognising faces and other living things in full colour, rather than random 3D shape mirror matching in grey scale.
Hi Marco,
“if” there are 3d distance matches – as you think there are – they can be investigated statistically.
If there are few, you run into the low number statistics issue, meaning lack of evidence.
If there is a sufficient number (what this means can be elaborated rather detailed), using a 3d comet model should provide valid objective data to do the statistics necessary to determine the confidence level of your observations. (“Evidence” is defined by a 3-sigma confidence level.)
The first step is a formal definition of “match”. The second step is a global relation (a set of pairs) of matches according to the formal definition. That’s best done by a computer, since computers are less prejuidiced.
Then look at the 3d distances of the matches and their clustering.
(In e.g. astronomy there exist established techniques to identify observed stars in a star catalog.)
Clusters (data spuriously looking like correlated) are common in random data. Compare the clustering of random data with the observed clustering.
Randomization could be done with surface features of the comet itself, meaning the features with the property to be matchable.
Less clustering for more than 96% of the randomized surface relative to the actual surface would be considered as the surface being evidently non-random.
This would not yet prove stretch, but it would justify a closer look.
Below these 96% confidence you’re well within the usual noise level.
Avoiding mathematical models is a dead-end. No way to get from opinion to evidence.
Without a proper definition of the notions (“matching” and “feature” in this case), we don’t even know what we are talking about. Hence an essential step is the proper definition of the notions.
(sorry for the delayed answer)
Sorry for a little flaw in my previous post: You need to go to 99.7% for 3 sigma (to be considered as evident):
https://mathworld.wolfram.com/ConfidenceInterval.html
The 96% is just 2 sigma.
Btw. 5 sigma are called “definitive”, one spurious result in about 3 million cases.
Hi Gerald,
Of course a statistical investigation is desirable, but the models available (at least the publicly available models) have nowhere near the resolution of even the NavCam images that have the putative matches. Many of the NavCam images have resolutions of 40cm per pixel or less, which enables stirations on 10m boulders to be visualised as 3D features.
50m boulders on the best available models are formless blobs. Surely you can tell that if we *personally* do a statistical investigation it will reflect the limitations of the model rather than the statistical significance of the matches. There isn’t even published accurate dimensions of the comet nucleus at all! How can I calibrate sub metre matches when the overall dimensions are to the closest 100metres.
I have considerable concerns with the current modelling regime. As another example, the latest ellipse for the location of Philae has been drawn on a higher resolution model than before, but on cross checking with previous ellipses, the new ellipse is completely outside of the previous ellipse tens of metres away. This is with CONSERT coordinates which cannot have changed. Is the model wrong, or has the comet nucleus morphed?
Hi Gerald,
I have had a look at the resolution of the latest model and my judgement is that a statistical investigation of what we call the “large scale matches” would result in at least a 3 sigma confidence level, even with the limitations of the model as I had mentioned.
The definition of a match for each point would be determined by whether the corresponding other point in space which it would have broken away from is actually on the surface of the comet (within model error bars probably 10 metres) for a randomly selected initial point and reference plane for the distance and direction for the next match, the chances that the next point will land on the comet is very slim. Even if you randomly select a point from a seemingly correlated ridge, the comet is so jagged in the scale of 100m such that a coincidental match would be perhaps one in ten *for every sequential point*, and since the calibration points which determine translation and rotation of the 3D path in space which the head rim features to map to were determined independently of the large scale matching points being measured on the model, there is no selection bias. The probability that the match is a coincidence is the probability that two long sets of features on one part of the comet can be made to neatly rest on the surface of a randomly selected other part of the comet (within error bars of the model)
Hi Marco,
if you would succeed to fully pin this down, and apply it to one of the published shape models in a fashion that it survives review, with the 3-sigma confidence, this would be a result requiring an explanation.
It could turn out to be of value, independent of “stretch”.
If you fail to achieve the 3-sigma level, the least result is, that you learned to work scientifically, and you get a quantitative measure of how real those matchings are.
Hi Gerald,
The 3D model fitting exercise will happen, but as I said, there are limitations in the model, and no accurate neck length measurements which would go to the more falsifiable aspects of stretch theory. As a skeptical scientist, I am just as happy to prove it wrong than prove that “it is worth further investigation” I know damn well that it is worth further investigation. What you are talking about is proving that it is worth further investigation.
Clear criteria based on expectations of traditional sublimation driven surface remodelling will be a lot more fruitful than a match that is real but nobody believes.
Another clear criteria that should be plausible now is to see if there is continuing stretch. Measurements of the length of the neck or the total comet should be accurate to the nearest metre given the accuracy of instruments. No such data has been published since this time last year, and it was only accurate to 100metres.
Nothing can be “proven to be worth further investigation” if such basic data is withheld or delayed for unspecified reasons. If stretch is occurring, it will become very obvious by the end of the mission regardless how much time I spend trying to “prove it is worth further consideration” with the scraps of information that the mission scientists deem is important for the rest of us.
Hi Harvey,
Stretch theory is completely evidence based, and I do not count “models” as evidence whatsoever. Stretch theory is consistent with all the measurements made of density, surface hardness, emissions, spin measurements etc.
It is consistent will all known physics and chemistry. No new physics has to be invoked or modified.
Can you elucidate your problems with stretch theory that do not invoke evidence from computer generated formation models? The models are useless if the premises behind the models is wrong, or for the benefit of the argument, if we cannot agree on the premises, then arguing the toss on models is pretty pointless.
A.Cooper has documented how surface features and morphology relates to the stretch event and all aspects of the comet and history. All the pieces are miraculously fitting together despite contrasting markedly with ideas from mission scientists. I just can’t help feeling that everyone is ignoring something really paradigm changing.
Thanks Harvey!
Read it and I also had seen this recent 3d simulation video showing their accretionary “Spat-Duck” forming…
https://.phys.org/news/2015-05-comets.html
To me visuals are worth ten thousand words in addition to that paper.
Now imagine the video kept going, spin slowed and perhaps with you maginary extra gravity, the soft neck melted/compressed down into the body, forming an ovoid shape.
OK, now run it backwards from that point, except first introduce explosive gasses blowing off the head around a circular cracking fracture. A little more spin… A little more… Stretch that Neck!
Reminds me of a toy I worked on in the Nineties called “Stretch Armstrong”! Oh, and “The Nurd” in the eighties.
Both filled with tar-thick viscosity, elastomeric cornstarch and sugar goo, surrounded by a shaped thick latex balloon.
Sorry, that’s getting off track.
If I get some time from my startup toy company, I would like to make my own “3D video” supporting Andy and Marco’s Stretch Theory, some day.
I would use stop animation and Play Dough. First, form an ovoid shape, with a pre-head lump, then bake with a heat gun so it forms a brittle thin crust.
Introduce a crack around the lump and slowly pull it apart.
I’m pretty sure I will get the same concave neck and duck shape too.
Both theories are viable, I just feel Stretch Theory is gaining ground now.
“Splat-Duck”, not Spat-Duck too!
Es impresionante ver la superficie del cometa gracias a la tecnología desarrollada ya hace una década. Enhorabuena!
@Ramcomet:
“Ramy was doing fine until he supposed the fractures in Hathor…”
He might be right (or wrong) as we might be right (or wrong).. The more you look, the more you see, from every scale and direction. What we have here is a primordial body with a primeval surface that was accreted at the beginning of time and has been in the deep-freeze frost-burning for aeons.
The difficulties in showing this MC Eschersque world can be illustrated this way:
https://i.huffpost.com/gen/647942/thumbs/s-03929_PO_ESCHER_02-large640.jpg?4
–Bill
Absolutely agree, Bill, and thanks, I love the M. C. Escher analogy. Fractals come to mind as well as, (just for fun) – the Divine Rectangle.
I think I overstated my comment on the article. There is certainly nothing wrong with Ramy saying, “…could have resulted from the comet’s formation, perhaps when two smaller cometisimals collided…”
I just lament the absence of any other possibility. A best case might be, “…or, other mechanisms such as Stretch Theory, as promoted by some in ESA’s Rosetta Blog…”, which to me anyway, seems to be gaining more and more traction.
But papers probably need to be focussed in “most likely scenarios” as understood at the time by the authors, not to muddy the waters or “stretch” the imagination too much. So, I understand my reference to The Wall was probably overkill. 😉
Although Holger also completely drove by it when Andy asked the Stretch question near the end of the last Hangout… did I detect a half smile and some rolling of the eyes? 😉 😉 😉
Claudia
There’s something fundamentally wrong with the Captcha process for mobile devices on the Rosetta blog. I’ve been using an iPhone. I spent half an hour trying to post a reply to Gerald on Saturday on this thread: I had to go through 30+ screenloads of pies and street signs, most of all of which I got right and I’ve had never had any problems with before. The audio version accepted my answer but wouldn’t allow me to copy the verification link to paste to the box.
I finally got a screenful of pictures ‘correct’ and that allowed me to copy and paste the link- but the comment didn’t come up as ‘awaiting moderation’ and was never posted.
I tried again today and went through exactly the same process with the same reply to Gerald. After multiple screenloads and attempts at copying the verification link I finally got one pasted one in the box. It allowed me to click ‘post comment’ but it still hasn’t come up as ‘awaiting moderation’. I’ve now spent over an hour on one comment that usually takes me 15 seconds to paste in, type a Captcha code and post.
Could you sort out the problem soon? I don’t want to be left behind in the discussion.
[I’ve had to send this from a friend’s desktop computer].
Thanks, A.Cooper
Dear A.Cooper,
Our teams are looking into this issue.
With best wishes