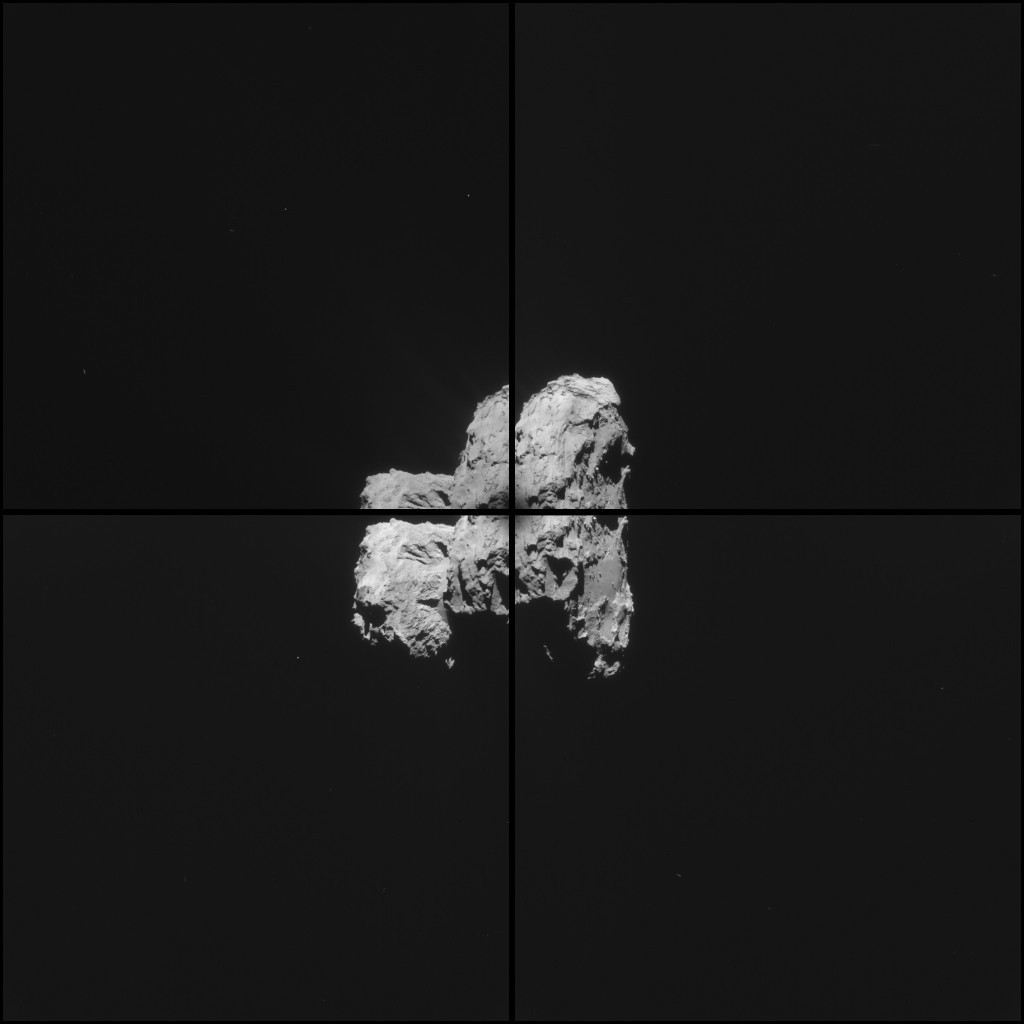
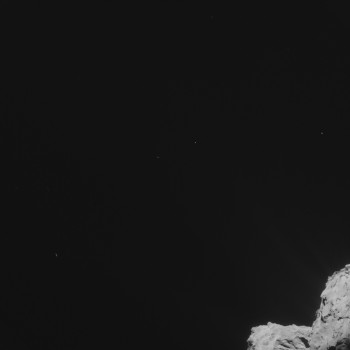
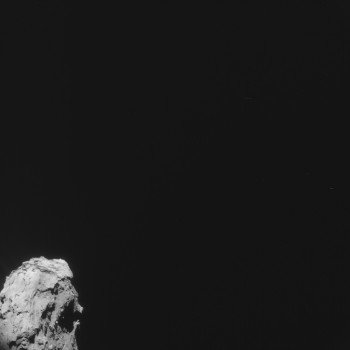
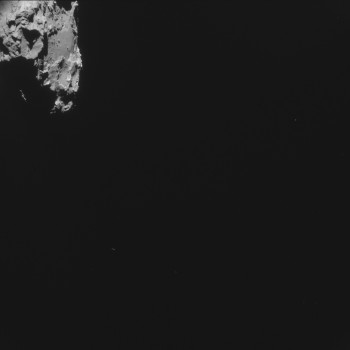
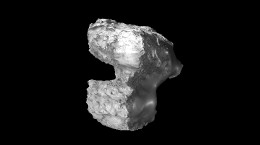
This four-image mosaic comprises images taken from a distance of 94.3 km from the centre of Comet 67P/Churyumov-Gerasimenko on 26 February. The image resolution is 8.0 m/pixel and the individual 1024 x 1024 frames measure 8.2 km across. The mosaic measures 14.6 × 14.7 km.
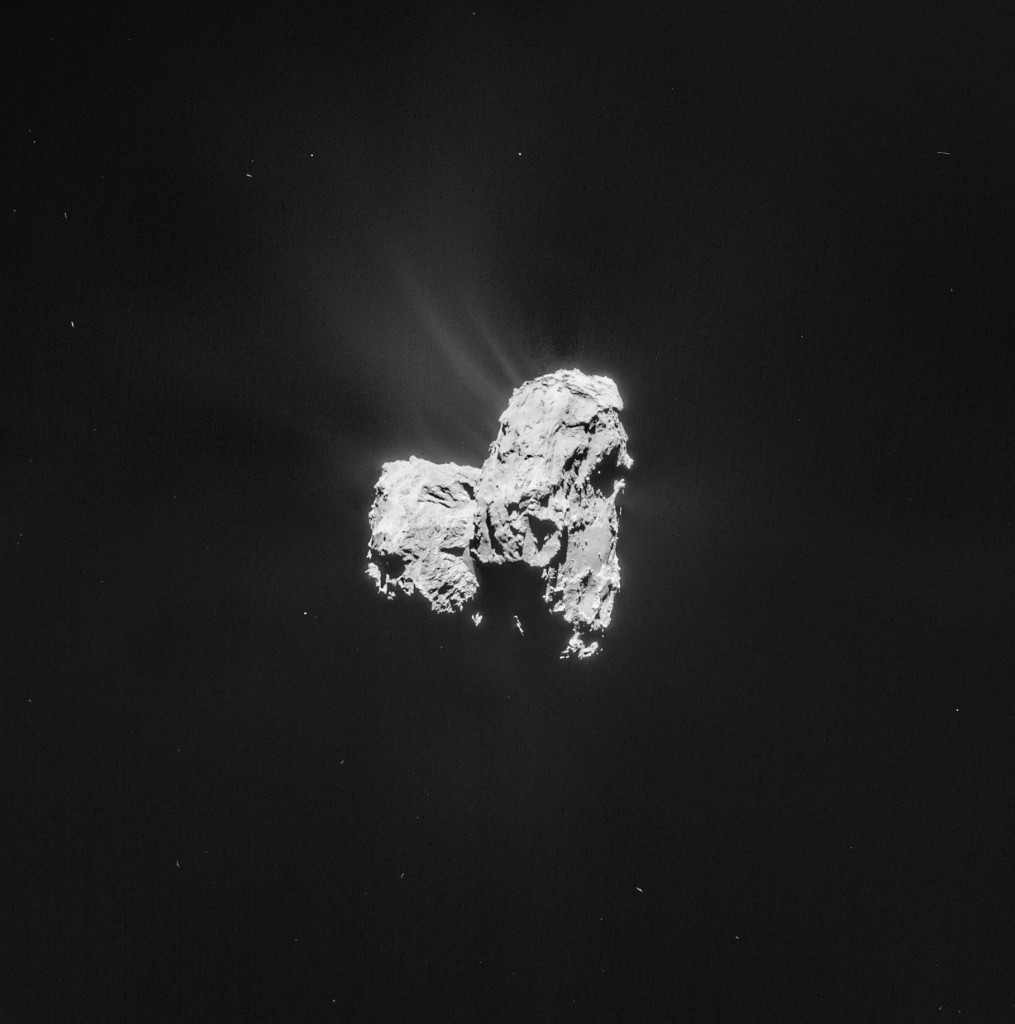
Four image mosaic comprising images taken on 26 February 2015 by Rosetta’s Navigation Camera (NAVCAM). There may be some spurious spatial and intensity features as a result of the mosaic-making sequence, so always refer to the individual frames before performing any detailed comparison or drawing conclusions about any strange structures or low intensity extended emission. Credits: ESA/Rosetta/NAVCAM – CC BY-SA IGO 3.0
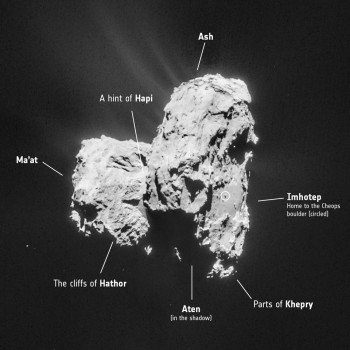
Cropped and annotated version of CometWatch 26 February. Credits: ESA/Rosetta/NAVCAM – CC BY-SA IGO 3.0
In this slant view, the comet’s large lobe is on the right, and the small lobe on the left.
On the left, the image is dominated by the cliffs of Hathor with hints of the smooth Hapi region, both on the comet’s neck. Moving towards the right, we see most of the Ash region on the large comet lobe and, on the underside, the Imhotep region with its constellation of boulders. Indication of activity is also visible in the upper part of the image.
We prepared an annotated view of today’s CometWatch to help you find your way around the image. You can also find regional maps of Comet 67P/C-G here and here.
The four-image montage and the individual 1024 x 1024 frames are provided below:



Discussion: 16 comments
As you added annotation of the region names this time I’d like to ask for a clarification about it, where exactly is the Apis region? I will use the map at https://www.esa.int/spaceinimages/Images/2015/01/Comet_regional_maps as the other one doesn’t even contain Apis.
Beginning with the upper left view of the comet, the Atum region reaches all the way up to the “overhang” in the upper left. What I call the “overhang” is the area just of to the left and a bit down of the word Atum. But then I look at the lower left view of the comet, there the “overhang” is marked as being a region called Apis, rather than simply a part of Atum. Now the region markings might not be 100% exact but here they are very contradictory so it would be nice with a clarification.
Technically either Apis or Atum is thus seen in the NAVCAM image, although you haven’t marked all the visible regions either way so maybe you just skipped it because it’s such a small part of the view.
@Daniel: I annotated a shape model using those maps to help me answer questions like these. See website link: https://www.chiark.greenend.org.uk/~jacobn/2015/01/67p_model/
Using it, in this new view, I think Apis is the region at the very top right — my label for Apis would be to the right of the one for Ash.
(Unfortunately I haven’t found a good way of displaying the model interactively in a web browser, so you’d have to have the right software to view it.)
Using a model definitely simplifies things, although as you yourself point out the one you’ve got is a non-standard .obj which is a bit unfortunate.
Either way it seems I wasn’t clear enough, I agree that Apis/(Atum) is at the very top right. The issue is that the region maps we have are contradictory. It could be Apis but it could also be part of Atum.
Most likely it’s Apis only, but using the maps we have Atum overlaps Apis.
Oh my god I see it blue and black and my friends see it white and gold !!
Thanks Claudia. The Cheops boulders been initially taken as being on the line of the equator, so I am interpreting this view as being almost perpendicular to the equator. It is interesting to see the clear demarcation of terrain on the head lobe, a distinct ridge line, which separates the “dusty”, rolling terrain of the Northern “hemiduck” from the scoured, angular, rugged terrain to the South.
There three very large cave features visible here, marked by their shadows. One at the Northern edge of Imhotep, another at the Western edge and one at the left edge of the head lobe. All three face South along with many other smaller cavelike features. The conclusion must be that during the summer, the higher intensity of Solar radiation has something to do with their formation.
Sometimes the Naming of Names is imprecise when applied to regions. 🙂
–Bill
Did I have a wrong impression on the jets?? Anyway this is a very interesting view because I have thought that the largest amount of jets are coming from the most shrinked part of the neck. Maybe still they are. But with this orientation of 67P it can be look like Seth and/or around it are also the regions that’s most active. Are the jets from the most shrinked part of the neck coming out roughly towards NAVCAM??
Anybody seen an image of 67P/G-C taken from Earth lately?
a comparison would be quite interesting. An internet search came up negative.
That is because sun is in the line of sight these days.
Could any one tell me if there is any official info about jet bending?
Take a look at all those stars! The most, the bigges and the brightest are not stars: they have motion blur i different directions meaning they are objects related to 67p. Some may orbit (perpendicular motion blur) some escaping, some may be reimpacting (needs picture sequence /video to be determined)
Could this disturb star tracking?
Jacob
Material escaping from the comet affects the spacecraft in several ways, but the most significant are the drag on the spacecraft affects its motion, so that its path is less predictable and secondly the star tracking ability is degraded, possibly to the extent where operations could temporarily shut down because Rosetta cannot be sure of its position and orientation. It is for these (and perhaps other) reasons that Rosetta is now being kept deliberately further away from the comet than the close orbits achieved in late 2014. As both objects approach perihelion the separation will doubtless have to increase, but preservation of Rosetta is a top priority as the scientists jobs depend on that, and there would be a loss of future data if it were lost prematurely.
There were reports that on the recent close pass Rosetta’s star tracker was confused by ejected particulates, and the spacecraft ‘nearly’ went into safe mode, shutting down instruments. (It’s not quite clear what that means, but that was the report!)
Certainly the safety of the craft is paramount; we really want it alive for perihelion and beyond, even at the cost of reduced resolution.
Usually a spacecraft entering safe mode means shutting down anything that isn’t critical for the operation of the spacecraft itself. Scientific instruments are obviously not critical for the operation of the spacecraft. During a safe mode the only concern is usually to maintain some attitude control (e.g. solar panels kept towards the sun) and trying to make sure that some kind of contact can be kept with earth.
Star trackers getting confused is thus not a good thing, as they keep track of the attitude of the spacecraft. But apart from star trackers a spacecraft can have, and I assume Rosetta has, some kind of sun sensors and gyros to estimate its attitude.
Now Rosetta wasn’t in a collision course with 67p, so a safe mode during the flyby probably wouldn’t have resulted in anything worse than a loss of data either way. It might however have set future plans back a bit while the health of the spacecraft was checked and systems were turned back on again.
Unless it was the ‘nearly’ part you were not clear about, in which case that’s more than I know.
Yes, I’m familiar with safe mode, it was the ‘nearly’; what is the algorithm?
ESA are increasingly stressing drag as an issue. I wonder if the near comet drag could convert a close pass to an impact path, perhaps if there was an outburst of gas? Otherwise it’s not obvious why the star trackers are included In the decision to go ‘safe’.