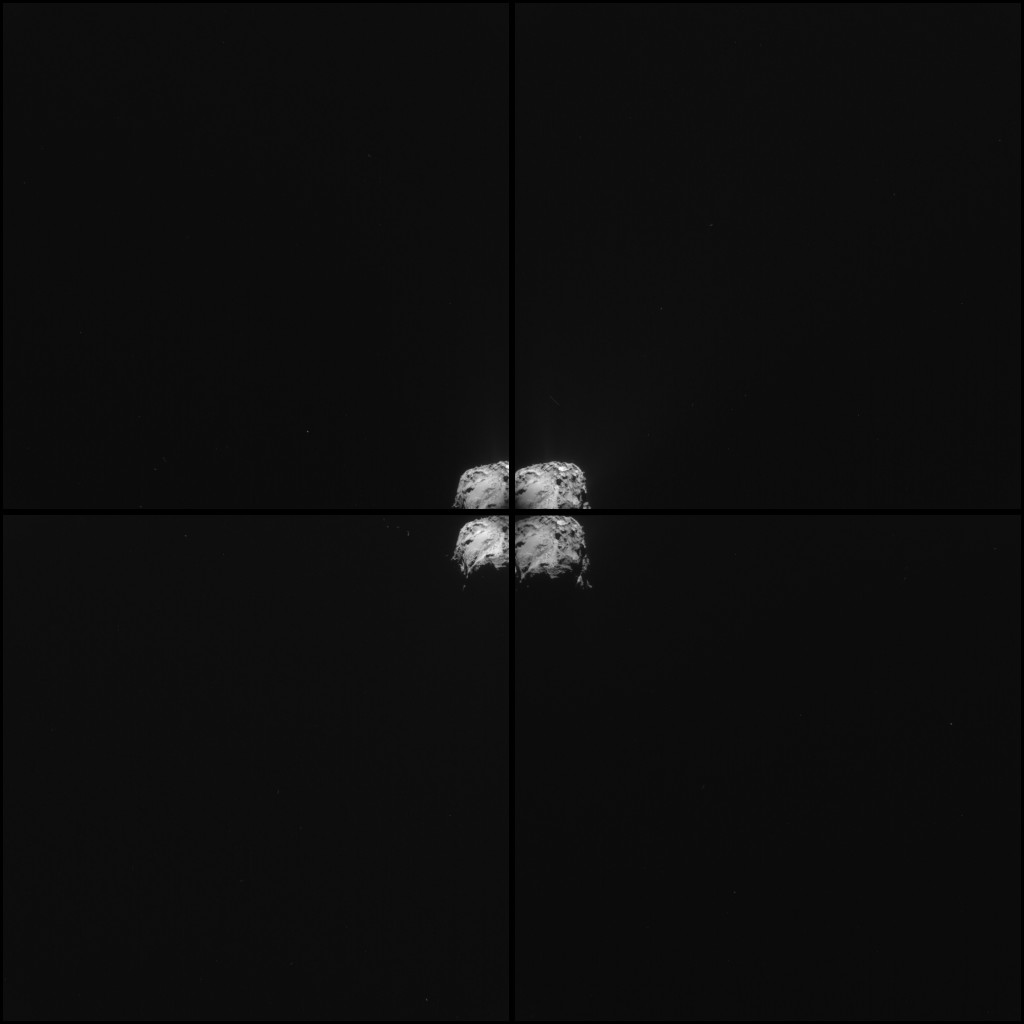
Today’s CometWatch entry presents a four-image mosaic comprising images taken from Rosetta’s NAVCAM on 16 February from a distance of 226.5 km to the centre of the comet. The image resolution is 19.3 m/pixel and the individual 1024 x 1024 frames measure 19.8 km across. The mosaic measures 37.4 × 37.2 km.
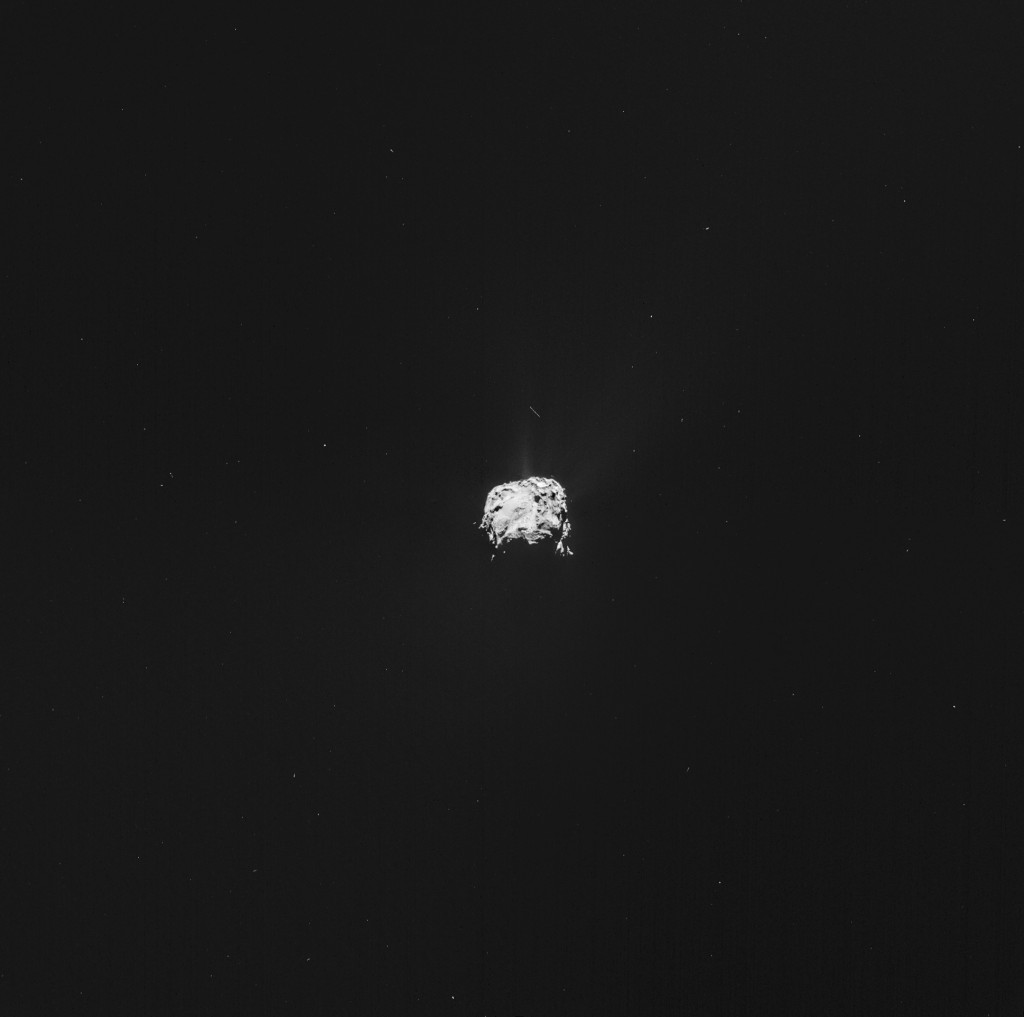
Four-image mosaic comprising images taken on 16 February 2015 by Rosetta’s Navigation Camera (NAVCAM). Rotation and translation of the comet during the imaging sequence make it difficult to create an accurate mosaic, and there may be some spurious spatial and intensity features as a result of the mosaic-making process, so always refer to the individual frames before performing any detailed comparison or drawing conclusions about any strange structures or low intensity extended emission. Credits: ESA/Rosetta/NAVCAM – CC BY-SA IGO 3.0
The view shows the underside of the large comet lobe, focusing on the smooth Imhotep region and its transition to Ash on the right. The mosaic has been processed in Lightroom to bring out some indication of the comet’s activity, in particular the jet pointing upwards.
Today’s CometWatch comes from close to the end of the trajectory arc that took Rosetta 255 km from the centre of 67P/C-G on 17 February; this is the furthest the spacecraft has been from the comet since early August 2014, just before rendezvous.
A comparison of this image with CometWatch 15 February, also featuring Imhotep, and with the close-up view of the same region from the 14 February flyby, provides a taste of this leg of Rosetta’s journey receding from the comet.
Rosetta is now approaching the comet again. Today, 20 February, it is around 100 km from 67P/C-G.
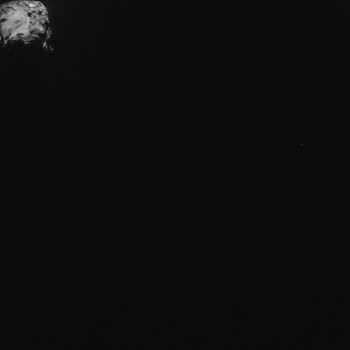
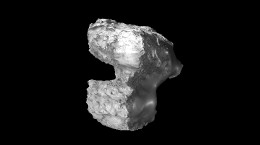
The four-image montage and the individual 1024 x 1024 frames are provided below:




Discussion: 23 comments
I’m attending a Rosetta presentation next week where I hope to ask questions about the source of the strong jets from the neck area, and why temperatures in that area are higher than elsewhere. Anything else I should ask of general interest (rather than really detailed specifics).
I’ll try to ask about electrical activity too.
Keep up the great work!
Hi Graham Hall. If ‘electrical’ is something too untouchable ask about ‘magneto dynamics’ 😉
Is the presentation open to the public?
If so, where is it being presented?
Its in London England, and yes its open to the public and its free!
‘What is the current information on the formation of the bow shock’.
That would be a nice straightforward short question, posed in terms the team will feel comfortable with, which essentially addresses the local plasma enrironment of the comet.
Harvey,
as far as I know (a little more than rumors), it’s considered to make a trip to the bow shock, some 2000 km away from the nucleus.
I’d love to see a fly out like that for the plasma data. But obviously the time it takes, fuel consumed, and any risks, will all have to be traded off. I’d guess almost only the plasma guys would want to go right out there though, so it may be a hard case to argue. There might be some interest in the MIRO and mass spec data out there fairly far out into the coma. But none of the imaging instruments would want to be that far out.
Graham, to check out a possible electrical component, perhaps you could ask what degree of ionization has been detected in the jets and what species of ions are present. And more generally, what was meant by “sputtering” when the term was used by ESA to describe activity on one of the lobes.
I sure wish I could be there myself!
Emily,
Any chance of a brief, verbal summary of the plasma data from the fly out? Indications re the formation of a bow shock? Would be *very* much appreciated!
Not gonna happen – 6 months.
Well actually such an answer was kindly provided informally a while back in these blogs, so there is a little hope 🙂
They are writing papers against the clock of public release of the raw data.
What could be more damaging to a big particle squeezing out from that cryo- volcano, geyser like, main jet source.
The multiple wall impacting, or the nearly instantaneous exposure to void?
Found this on the web:
“…However, the magnetic pile up region can be identified in both cross-sections. Inside this structure, the magnetic field strength reaches about 30 nT.”
As seen on fig. 6, is this lenticular ‘pile up’ zone the one able to focus the field force.
https://www.sciencedirect.com/science/article/pii/S0032063313002146?np=y
That document:
“Revisiting cometary bow shock positions, by C. Koendersa, K.-H. Glassmeiera, I. Richtera, U. otschmannb, c, M. Rubind. Received 4 March 2013, Revised 8 August 2013, Accepted 14 August 2013, Available online 29 August 2013”.
Predicts a magnetic pile up for 67P from 2015Abr to 2016Jan. And a bow show 2015Jul to 2015Oct.
Logan. An important fact to note is that the bow shock position depends on the gas production rate from the comet. It moves further out as more gas is produced and needs a certain amount to form at all. We haven’t had an estimate of that rate in quite a while, although MIRO and mass spec data must be providing a lot of data on it. The plasma measurements should show quite clearly when the bow shock forms, and largely shields the comet from the solar wind. It will then just see the local, photionised plasma close in.
They have been unambiguously observed directly on several comets, and are relatively well understood theoretically. Assuming 67P out gasses ‘enough’, as it surely will, a bow shock will form – it may well have done so already.
Sheaths and double layers are entirely different things; the bow shock is due to the comet’s supersonic motion.
Hi Harvey. “…We haven’t had an estimate of that rate in quite a while”. I am eagerly waiting for the REAL data too, Harvey 🙂
Guessing this MHD simulation was contracted in order to know the basic constricts of this flyby phase.
“Shock bow… moves further out as more gas is produced… “. Not so sure about 67P doing this. As more gas is produced, also the fall into our Sun gravitational well goes further, increasing solar wind pressure at the front. Maybe at outbursts.
As the coldest day at Earth’s North Pole goes around Feb13? Maybe 67P has the same kind of inertias. Then we will see peak activity after perihelion. Then 67P will have stabilized solar wind pressure and [still] increasing gassing.
Logan. Because the rate of gas production is a very nonlinear function of the comet temperature, ( exp(-K/T), from the delightfully named Clausius Clapeyron equation if you want to look it up) would expect the increase in gas production rate to have a much bigger effect than the relatively small increase in solar wind density (square law).
I’d have to go dig up some references, but I think Halley’s bow shock was seen to move further out as it approached the sun.
Indeed I’ve never yet seen an explanation from the EU community of the violent nonlinearity of comet activity with distance, readily explained by sublimation of course.
“… the violent nonlinearity of comet activity with distance, readily explained by sublimation of course”.
Thanks for the guide, Harvey. That formula is too much for me. Curvatures on the graphs of MHD simulation go along with your argument, too. Still adding in favor of your argument a expectancy of thermal inertia.
Philae’s initial findings talks about significantly higher values than those predicted in this MHD simulation with those parameters, if I understand those graphics.
This paper gives a nice simple picture of where the bow shock is expected to be as a function of the date, and high/low activity scenarios. I wouldn’t treat these as exact predictions, just the sort of figure to expect.
https://meetingorganizer.copernicus.org/EPSC2013/EPSC2013-425-1.pdf
As latest photos have shown. I would vote for the High Activity Case 😉