


In his next post, Gavin Tilstone from the Plymouth Marine Laboratory details his next leg of the journey through the Atlantic as part of the AMT4 OceanSatFlux project, supported by ESA.
After a couple of weeks of storms, the ocean has become like glass with a slow undulating ripple. The ship cuts through the oily slick effortlessly, creating a flutter of flying fish as they glide and bounce like skimmer stones on the smooth surface. At the pre-dawn sampling station, they are attracted to the rosette and CTD as the deck lights lure zooplankton to the surface.
We are steaming from the great desert of the North Atlantic Gyre towards the Equator –passing close to Cape Verde. A lone swallow ambles on the bow keeping up with its temporary floating roost. Each day, there is evidence of old gold and orange-coloured dust covering the Bow. With the ship facing head to wind, layers of dust turn the ship’s steel green super structure into a Bedouin mosaic. The white filters in our atmospheric particle sampler have become like a doormat of sand.
The dust originates from the African Sahara, the extent of which we can be seen in the satellite imagery that is being sent to the ship by the National Earth Observation Data Archive and Analysis Service (NEODAAS) at Plymouth Marine Laboratory (PML). Saharan Dust is rich in metals, especially iron, which limits phytoplankton growth in the North Atlantic.
As these vast dust plumes are propelled ocean ward from the North African desert, they become a fertilizer for the phytoplankton, initiating patchy and meandering blooms. A hue of excitement resides around the CTD screens as we traverse these greener waters after being in the less productive of the Northern gyre.
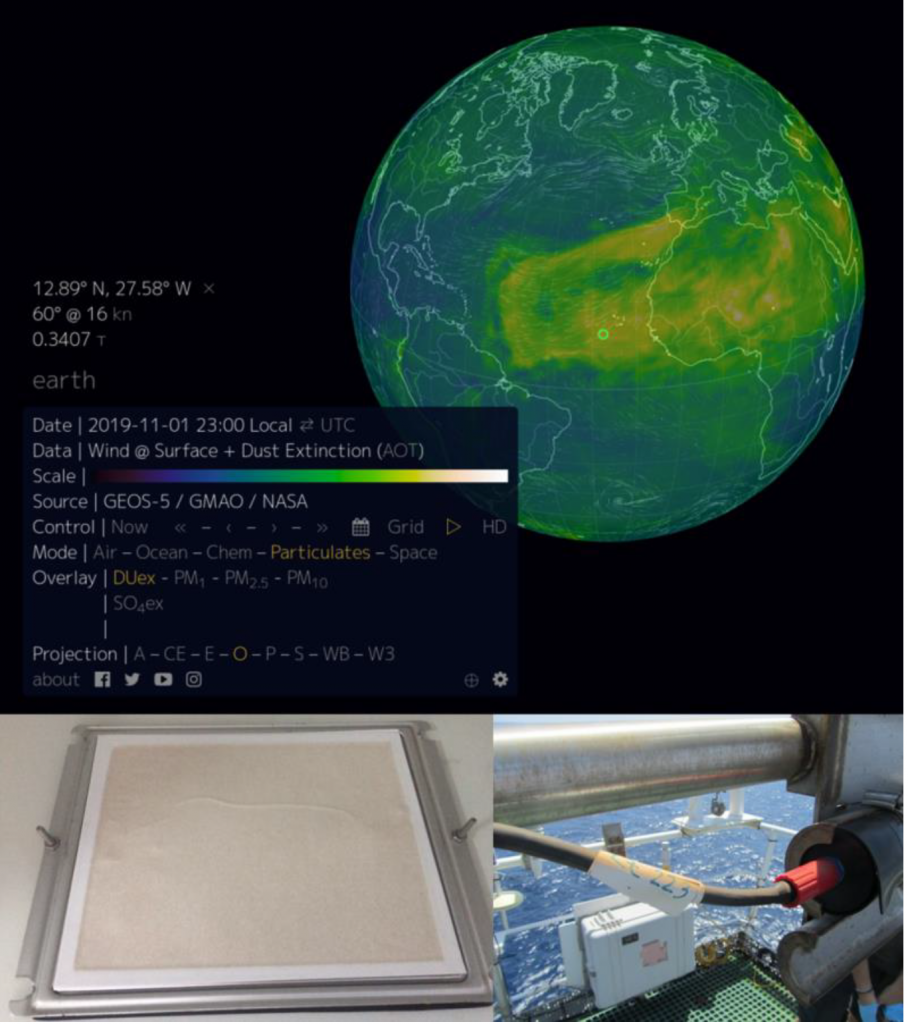
Saharan dust seen from modelled data – on the atmospheric filter and the radiometer cables. (PML)
BUT why is all of this important and what are we doing out here?
Collectively a group of us are quantifying carbon cycling in the ocean from the CO2 in the atmosphere to its absorption or release from the ocean to its fate in the euphotic zone – and beyond towards the deep ocean.
The oceanic concentration of CO2 has increased by more than 40% since pre-industrial levels, and continues to rise annually by 0.4 % (IPCC 2013). The current seawater concentration of CO2 has reached 400 μatm and is predicted to increase to >700 μatm by the end of the century. This continued increase in CO2 to the ocean from the atmosphere has resulted in a decrease in seawater pH, such that sea water is becoming more acidic. This phenomenon is known as ocean acidification.
The main objective of what we are doing out here on the ever changing landscape of the Atlantic, is to estimate the air-sea flux of CO2 calculated from satellites. From the measurements that we make in the water column and translating these to orbiting satellites overhead, we can scale up our observations over the Atlantic Ocean.
When we started the campaign in Southampton, Tom Bell and Ming Xi-Yang from PML joined the ship for mobilisation to set up both an eddy covariance instrument and Picarro. The eddy covariance instrument measures wind velocities over the sea surface at very high resolution. The Picarro instrument measures CO2.
By coupling these instruments together and relaying the data back to a remotely accessible server, we are able to get autonomous near real-time measurements of the air-ocean CO2 flux from where ever the ship is.
Prior to visiting RRS Discovery to install these instruments, Tom and Ming had also been to the RRS James Clark Ross to install the same instrumentation on this ship as well. This therefore gives us CO2 flux data from two vessels (RRS JCR and Discovery). Both ships are transecting the Atlantic to the Southern Ocean during the same season, enabling a cross-platform comparison of CO2 flux measurements.
Ian Brown (PML) also visited both ships to install or service an underway pCO2 system that continuously measures the CO2 concentration in the surface water. Daniel Phillips (PML) then measures the concentration difference between the CO2 in air and CO2 in water to quantify the CO2 gas transfer resistance at the surface of the ocean.
The flux of CO2 in and out of the ocean is controlled and regulated by Sea surface temperature (SST), salinity (SSS), wind speed and sea state and sea-spray aerosols. Temperature and salinity affect the interfacial concentration of aqueous CO2 primarily through their effect on the solubility of sea water (Wolf et al. 1999, Tellus, 51B, 461–476). Partial pressure differences between CO2 in air and in sea water driven by wind, regulates the amount of CO2 entering or leaving the sea surface.
Werenfrid Wimmer from the University of Southampton is measuring the sea surface skin temperature of the ocean remotely, at very fine spatial and temporal scales, using Infra-Red radiometers. Louis Marie from IFREMER also visited the ship in Southampton to install c-band radar on the ship’s met platform. These radar measurements are used to interpret and quantify upper ocean dynamics in terms of sea roughness and surface state which, also modifies the flux of CO2 over the air-sea boundary.
Marine phytoplankton is responsible for half of the Global uptake of CO2 from the atmosphere. In turn, these tiny microscopic plants enrich our atmosphere with O2 and provide all of the food for the entire trophic food web in the ocean. CO2 in seawater is fixed as carbon by the marine phytoplankton, through one of the most powerful engines and pumps known to (wo)man; photosynthesis and the carbon pump.
Nina Schuback (Swiss Polar Institute), Polina Lobanova (University of St Petersburg, Russia) and myself (Gavin Tilstone, PML) are measuring photosynthetic rates and the fixation of carbon by different size classes of phytoplankton over the euphotic zone. In turn, Dan Ford at PML is also measuring how much of the carbon fixed by phytoplankton is then respired. This is complemented by optical profiles of the scattering of light in the water column which are used to estimate the carbon standing stock of phytoplankton.
Once CO2 is taken up by phytoplankton and incorporated into its cellular structure, it then either sinks to the deep ocean, is recycled in the euphotic zone or is broken down and re-released. The break down and re-release of CO2 is controlled by zooplankton, microscopic marine animals, bacteria and marine viruses, which feed on phytoplankton re-releasing the contents of their cells as nutrients. The marine system is therefore a delicate balance between phytoplankton growth, zooplankton grazing and the release and re-mineralisation of nutrients.
Any adverse effects on this tightly coupled chain can have major consequences higher up the food chain on the fish and whales that graze either the phyto- or zoo-plankton. Within the Atlantic Meridional Transect (AMT) programme, there are also a series of sediment traps in the deep ocean, that enable quantification of the carbon raining out of the ocean light zone and to the dark deep ocean where it supports a diverse wealth of deep sea creatures.
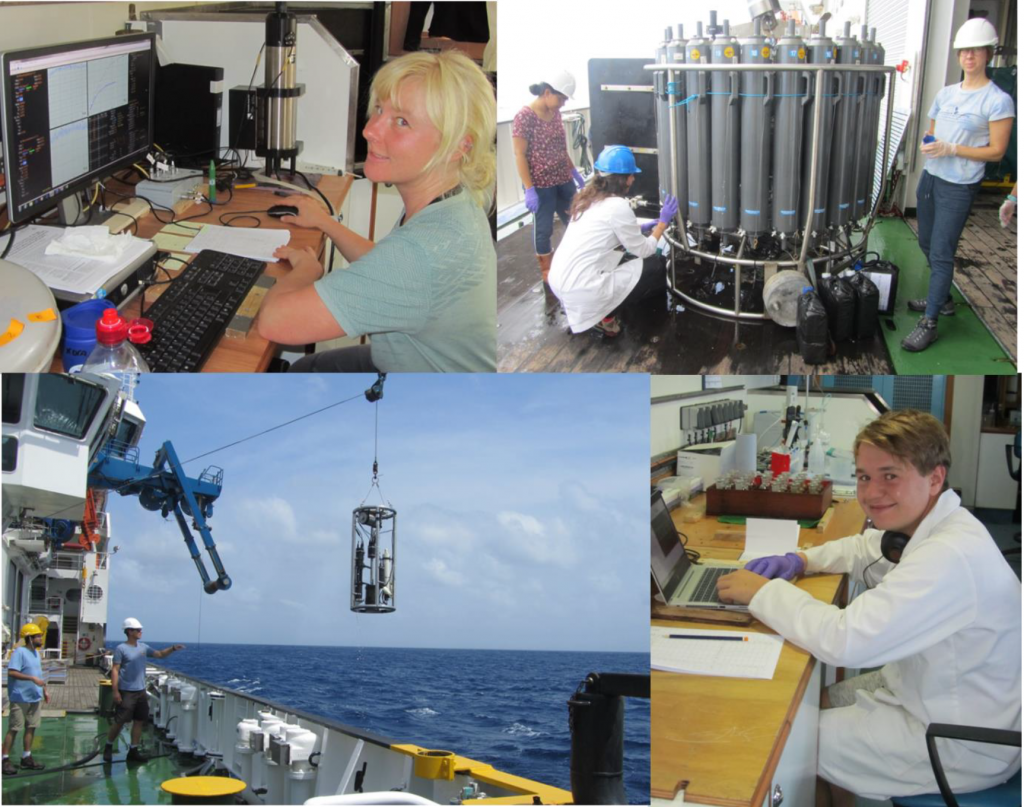
From left to right: Nina Schuback measuring phytoplankton photosynthetic rates, Polina Lobanova sampling from the rosette, Francesco Nencioli deploying the optical
profiler and Dan Ford measuring respiration rates. (PML)
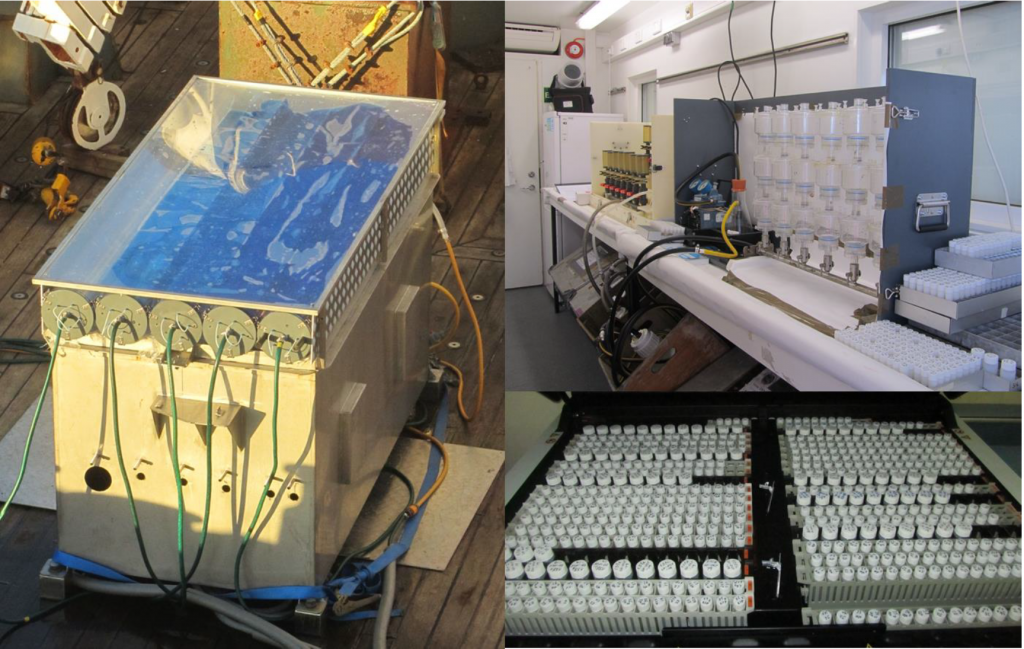
Quantifying the carbon fixed by phytoplankton in the ocean; from deck incubations to laboratory filtration and analysis of samples. (PML)
Once we have all of the data collected at sea, we use them to validate the same satellite parameters. Today, we have long time-series records of the essential parameters from satellite required to estimate the air-sea flux of CO2, such as Sea Surface Temperature, Sea Surface Salinity, Ocean Dynamics plus modelled wind velocities. Once we have confidence that the satellite data are accurate we use them to scale up from the sea to satellite.
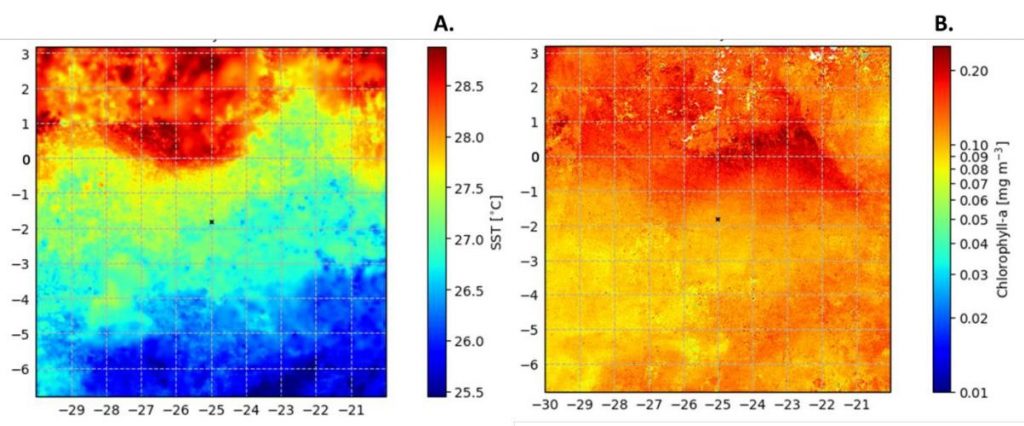
Satellite data of the region processed by NEODAAS (thanks to Will Jay); (A.) Merged sea surface temperature for the equatorial Atlantic (B.) the corresponding phytoplankton chlorophyll-a concentration around the equator from merged Copernicus Sentinel-3A and 3B OLCI data.
Back ashore, Ian Ashton from the University of Exeter is deriving estimates of CO2 flux using satellite time-series data and then using the data we collect at sea to verify that his estimates are correct. Silvia Pardo from PML is processing and sea truthing the ocean colour estimates of phytoplankton so that we can relate the CO2 flux to phytoplankton productivity. Also at PML, Peter Land is developing algorithms to apply to satellite data to study ocean acidification from space.
Anthropogenic CO2 emissions are buffered by the oceans, which have absorbed about 40% of historic emissions. This plays a crucial role in regulating changes to the climate by locking up CO2 from the atmosphere. Using satellite data we can extrapolate the measurements taken at sea over the entire Atlantic Ocean, so that we can assess changes in the ocean sources and sinks of CO2 under these times of increasing anthropogenic warming.
Post from Gavin Tilstone, Plymouth Marine Laboratory
Discussion: no comments