


On Thursday 22 September, the James Clark Ross refuelled in Portsmouth ahead of its mammoth journey to Stanley, the Falkland Islands and beyond, to the Sub-Antarctic Islands and to Rothera on the Antarctic Peninsula. As the ship slowly navigates its way through the Atlantic Ocean, following the contour of the Mid-Atlantic Ridge, data are being continually collected to assess the biological, physical and chemical properties of the ocean.
Each day we stop the ship at 04:00, 10:00 and 13:00 to send an array of instruments towards the deep abyss below us, to profile the water column and to send data back to the ship’s computer about the health and state of these waters.
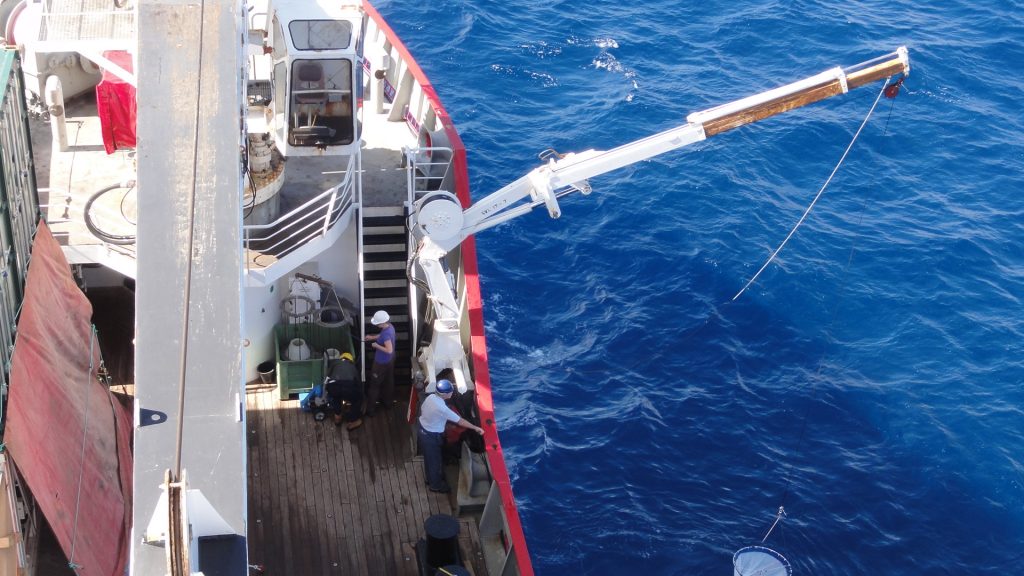
Taking measurements to validate Copernicus Sentinels. (PML)
When we are steaming between stations, there are a number of instruments that continuously log data along the ship’s track. Giorgio and Bob have a neat array of instruments mounted above the ship and plumbed into the ship’s seawater supply. The above water instruments mounted on the Forecastle mast are the SATLANTIC radiometers (HyperSAS), which measure reflected light from the sea surface every 10 minutes. These data are what the Copernicus satellites above us measure as they orbit the oceans.
Our measurements at sea are independent Fiducial Reference Measurements for verifying the quality of the satellite data. Whilst we are steaming, seawater is being continually sucked into the ships from the hull and flows into absorption spectrometer and backscatter meter. There is a WETLabs ac-9 which measures absorption (a) and attenuation (c) of the particles in the water column. Using these measurements we can measure the clarity of the water in the visible spectrum.
There is also a Hobilabs backscatter meter, which measures the backscattering of particles in the water column. The backscattered signal from these particles is what the satellites detect from the ocean surface. Werenfrid has mounted an array of infrared radiometers on the bow, which measure the skin temperature of the surface of the ocean continually along the ships track. The sea surface temperature is an essential variable that needs to be monitored to assess changes in temperature due to climate change.
Whilst in Immingham, Peter and Craig visited the ship to install C-band radar sensors. These instruments measure the surface ocean properties of waves and ocean roughness and allow us to estimate the sea-air flux of climate relevant gases, more accurately. They also provide reference measurements to assess the accuracy of data measured by the Copernicus Sentinel-1 satellites.
At each station that the ship stops at, we characterise bio-geochemical properties of the water column using a ‘CTD’, an instrument that measures profiles of Conductivity, Temperature and Density device. This is a stainless steel or titanium cage that houses temperature, conductivity (salinity), oxygen and fluorescence probes (phytoplankton biomass).
At the top of the cage there is a transmissometer that measures the transmission of light through the ocean, a Fast Repitition Rate Flourometer that measures phytoplankton photosynthetic response and a pair of Acoustic Doppler Current Profiler that measure particle backscatter to detect the size of particles in the water column.
Around the perimeter of the cage there are 24 ‘bottles’ that hold between 10 and 20 litres of seawater. Each bottle is a cylindrical, PVC tube with rubber sprung caps that close over the top and bottom end of the tube. The CTD is lowered into the water from a winch operated by the ship’s crew. As it descends, the profiles of salinity, temperature, fluorescence, oxygen are plotted on a computer screen in the control room. From these plots, we decide where to collect water and as the CTD is winched back up through the water column, it is settled at a desired depth, and bottles are ‘fired’ or closed using a computer software interface to capture the water from that depth. The CTD is deployed three times a day to about 300 meters, just below the light zone. On the first one at 04:00 Carolyn, Denise and Glen collect water for the analysis of nutrients, small phytoplankton and primary production (carbon fixation).
Another is lowered at 10:00, from which Giorgio, Bob, Manuela, Rafael and Francesco sample to assess the accuracy of the Copernicus Sentinel data. The third at 12:30 is coincident with the NASA satellites.
On one CTD cast we normally collect water from about 16 depths. The water is then drawn from the bottles into sampling vessels by the individual groups that perform an array of analyses from phytoplankton carbon fixation to genetic diversity. We will also do some deep casts to 4500+ meters, which take about four hours. From these, physicists Francesco and nutrient chemist, Carolyn, are able to identify the different water masses present in the Northern and Southern Gyres.
During the cruise we will do 100 to 120 CTD casts. At the 04:00 CTD cast Madeleine also deploys bongo nets which have a 200 micrometre mesh used to ‘fish’ zooplankton. The net is deployed from the forecastle crane, early in the morning to capture the zooplankton, which migrate closer to the ocean surface before dawn to feed on the phytoplankton. During the 10:00 CTD cast, Giorgio also deploys the optics rig that houses a number of instruments to quantify the optical properties of the sunlit ocean and beyond.
So, even while I am tapping away at my laptop, a variety of data are being collected, which will be used to validate the fleet of Copernicus Sentinel satellites and to aid our understanding of Atlantic Ocean dynamics in relation to climatic changes.
Post from Gavin Tilstone, Plymouth Marine Laboratory
For more information: https://amt4sentinelfrm.org
Twitter follow: @AMT4SentinelFRM
Discussion: no comments