Time is a child of the stars
When Duke William IV of Hesse-Kassel – “William the Wise” – thought how to spend his spare time, he decided to follow his passion for the stars: he wanted to know exactly where the stars are in the night sky and whether they move and if so by how much.
At the time – we are talking the 1580s here – it was well known from ancient times as well as from the then-young field of astronomy that most species of light in the night sky are ‘fixed stars’.
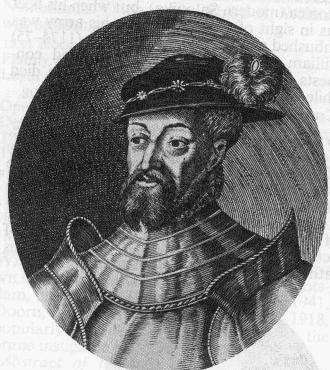
William IV of Hesse-Kassel (24 June 1532 – 25 August 1592), also called William the Wise, was the first Landgrave of Hesse-Kassel. He was the founder of the oldest line, which survives to this day. Credit: Wikimedia
Despite their name, fixed stars do move across he sky, only this is a collective motion caused by the Earth’s rotation once every 23 hours, 56 minutes and 04 seconds around its polar axis (as well as its orbital motion around the Sun every 365.2422 days).
So, what the astronomers of that time did was to use a telescope that was mounted with one rotational axis parallel to the Earth’s polar axis and another one perpendicular to it. The angle read from the perpendicular axis, i.e. the one perpendicular to the celestial equator, is called declination. The other angle – together with the local time of the measurement – included two pieces of information: the location of the star and the rotational state of the Earth at the time of measurement. Since all stars rise on a line that lies at a right angle to the Earth’s equator, this angle is called the ‘right ascension’.
As their instruments became more and more precise, astronomers found out that they needed to specify the time of day more precisely than to just the ‘minute’ – the unit that was the subdivision of the hour into 60 equal parts.
It was the Swiss clock maker Jost Bürgi working at the court in Kassel on the Duke’s invitation who decided to introduce the ‘hora minute secunda’ as a second subdivision of the hour, splitting the ‘hora minuta’ into 60 equal parts again – thus the second was born.
While there is much more to be said about Duke Wilhelm, this part of his life always fascinated me, because it is a testament to how much his work has become a part of the fundamental things that shape our everyday life.
Since the days of Duke Wilhelm, a lot has changed
Since then, generations of astronomers have iteratively improved our charts of the skies. One problem remained, however: if we measure the locations of increasingly dim stars, we are forced to use bright stars as a reference. As the distance from the reference stars grows, so does the error of measurement. This method of relative astrometry has its limits. This is one reason why a relatively young space agency decided to launch in 1989 a satellite that would ‘cast a net’ over the sky by measuring the relative angles between stars that are separated by 58 degrees in the sky using two telescopes.
That agency was ESA and the satellite was Hipparcos. Hipparcos had a hard time when it struggled with its orbit insertion manoeuvre, but the experts at ESOC managed to stabilize the orbit and redefine the science operations so that the mission was a huge success in the end.
Still today, the Hipparcos catalogue is the reference catalogue for the positions of Milky Way stars. But Hipparcos could do more than just mapping the sky coordinates of stars; it was in Earth orbit and as such moving around the Sun with the Earth. This motion allowed imaging nearby stars in front of distant stars such that their apparent motion due to the change in the observer’s location was visible.
Parallax and parsecs
You can try this effect – parallax – for your self: Put your index finger 20 centimetres in front of your eyes and focus at an object in the distance. Now close your left eye and record the position of your digit finger relative to that object. Now close your right eye and do the same. You’ll notice that your finger’s relative position has changed due to the parallax. You can even calculate the distance to your finger if you know only the distance between your two eyeballs and the change in relative position that you have observed.
In the world of astrometry your ‘left eye’ is the position of the Earth on its orbit around the Sun in – say – spring, and your ‘right eye’ is the position of the Earth in fall. Your index finger is a nearby star and the distant object is a distant star. The relative position of the nearby star is measured as an angle in seconds of arc (on 3600th of a degree), and the distance to the nearby star is measured in parsecs. A star at one parsec distance moves, apparently, in front of the background sky by two seconds of arc if observed in spring and in fall (provided some minor geometric conditions are fulfilled, i.e. provided it is located in the ecliptic plane and perpendicular to the spring point, but the general definition is true for any star).
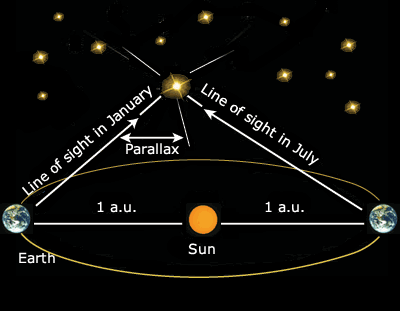
Parallax Credit: ESA
Some examples of parsec distances: the closest star to our Sun, Proxima Centauri, lies at a distance of 1.3 parsecs; Polaris, the northern star, at 132 parsecs; the Milky Way is 30 000 parsecs across.
Hipparcos legacy
The main product of the Hipparcos mission was the aforementioned catalogue with more than one million star positions. From that catalogue and measurements of the apparent brightness of stars in different spectral colours, a diagram of stellar life – the famous Hertzsprung-Russell diagram – can be drawn. We will talk more about how to compile a Hertzsprung-Russell diagram below.
This diagram gives an overview of how stars evolve along certain paths from bright to dim and from blue to red as they burn their nuclear fuel.
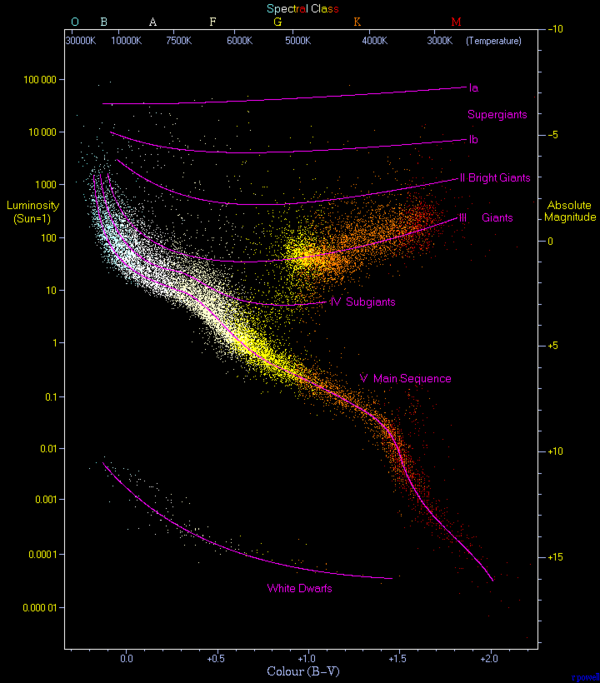
Hertzsprung-Russell diagram. A plot of luminosity (absolute magnitude) against the colour of the stars ranging from the high-temperature blue-white stars on the left side of the diagram to the low temperature red stars on the right side. “This diagram below is a plot of 22000 stars from the Hipparcos Catalogue together with 1000 low-luminosity stars (red and white dwarfs) from the Gliese Catalogue of Nearby Stars. Credit: Richard Powell/https://en.wikipedia.org/wiki/File:HRDiagram.png
The Hertzsprung-Russell diagram is the heart of the science of astrophysics. Much information about the stars’ host galaxy can be derived from it: its age, its initial composition, the expected abundance of chemical elements, the rate of star formation, the rate of supernovae occurrences, etc. These parameters can be fed back into the models of how planets form – including whether and at what rate complex molecules or even life can form in that galaxy.
In the end, the life of stars as recorded in the Hertzsprung-Russell diagram determines the characteristics of everything around us: from the DNA in trees and the metal in our cars to even the composition of our bodies.
Leaping ahead: Gaia
It thus makes a lot of sense to understand the evolution of stars in our galaxy – the Milky Way – very precisely.
So, after the huge success of Hipparcos, scientists in Europe started to think of a mission that improves our understanding of the stellar population of the Milky way even better – about one hundred times better. What do we need to make an even higher-quality Hertzsprung-Russell diagram? Precise distances and brightness measurements of stars in different spectral colours. Distances are determined from parallaxes – i.e. plane of sky positions – and brightnesses are measured by photometric instruments.
A new mission was born from those considerations: the Global Astrometric Interferometry for Astrophysics, or GAIA. The original idea was to improve the resolution of the imaging detector with interferometric methods to sub-pixel values. However, as pixels in real detectors have become smaller and smaller the interferometric methods were discarded from the instrument design (but by then the mission name had become accepted so it was kept as a proper name, ‘Gaia’).
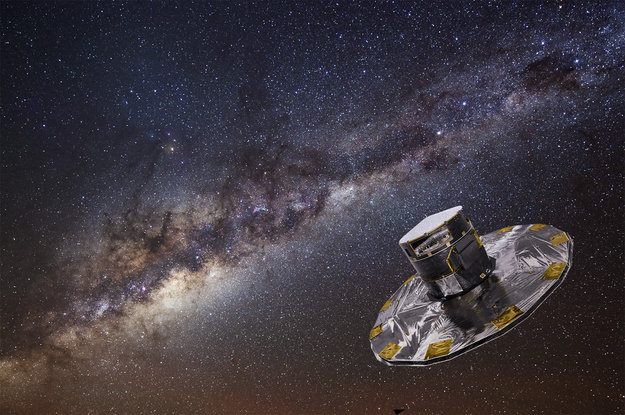
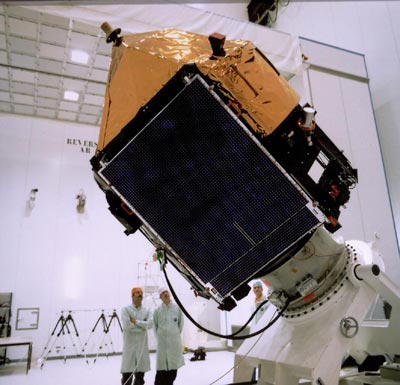
Gaia Credit: ESA
Gaia works in the astrometric mode just like Hipparcos: two telescopes (for Gaia, separated by the basic angle of 106.5 degree) will image the sky and the star positions in the two fields of view are measured relative to each other. In order to scan the full sky, Gaia rotates about its principal axis once every six hours with the spin axis tilted at 45 degrees relative to the Sun.
In order to optimize the sky coverage, the spin axis will precesse 29 times during the five-year mission around the Sun direction, while maintaining its constant tilt of 45 deg relative to it. Unlike Hipparcos, Gaia will not be in an Earth orbit: it will librate around the night-side Lagrange point of the Sun-Earth system, at which the three forces of Earth gravity, Sun gravity and centrifugal force of the Earth rotation around the Sun cancel each other. At such a libration orbit, the thermal conditions are very stable, which is required to operate the highly sensitive imaging sensors in the focal plane of Gaia’s telescopes.
The Gaia data storm
The total data volume expected from Gaia will be a staggering 1 Petabyte.
Mining this cosmos of data will yield one main output: The Hertzsprung-Russell diagram of the Milky Way. This diagram is the ‘tree of life’ of our galaxy’s stellar population. It will be compiled in the following way: For each star, the actual distance is determined from the parallax and the apparent brightness in all spectral bands from photometry. Given the apparent brightness and the distance, the absolute brightness can be computed. The absolute brightness of a star is one of the two parameters that go into the Hertzsprung-Russell diagram. Another parameter is the star’s colour as determined by its relative brightness in different photometric spectral ranges. With the absolute brightness and the colour, each star is entered onto the Hertzsprung-Russell diagram of the Milky Way.
Our galaxy’s stellar evolution
This way a map is created, on which each dot represents a single star. If we do that for all stars of the Milky Way, an intriguing pattern appears: a wavy line from bright to dim and from blue to red. If we now also add information about the star’s age from the measurement of metallicity (abundance of elements heavier than Helium, which can be measured from ground observations), we find that most stars evolve along a particular path during their lifetime: they start bright and blue and end up dim and red. We understand this from the nuclear process that determines the life of a star. Effectively, the Hertzsprung-Russell diagram is a map of stellar evolution in the Milky Way.
Like many things in astronomy, the Gaia data will have much more use than simply mapping stellar evolution.
Since 1992, we have had proof that our Sun is not the only star in the Galaxy that bears planetary companions. Today we know of about 800 such stars from various ground-based and space-based measurements. But this is only the beginning. All those 800 planet-bearing stars are quite close to our Sun compared to the vast expanses of the Milky Way. If the local planet population is any measure for a typical abundance of planets, each star of the Milky Way should have 1.6 planets, on average. While this is a bold extrapolation, more data on the planetary population in the Milky Way is needed to derive solid models of planet formation from their statistics.

Extrasolar planet Credit: ESA
In Gaia’s astrometric, photometric, and spectroscopic data, we will find five different ways to detect and characterise extra-solar planets; the ‘classic’ way to detect planets around a star is by the motion of its host star around the common centre of gravity. Two components of this motion can be detected: in the plane of the sky, the projection of the motion onto the sky as seen from Earth is visible in the astrometric data, while the projection along the line of the sky can be detected by the Doppler shift of characteristic absorption lines.
Putting the two-dimensional plane-of-sky projection together with the one-dimensional line-of-sight projection yields the full three-dimensional motion of the star around the star-planet centre of gravity. From this (and using the mass of the star), the mass and orbit of the companion can be determined.
Another measurement that reveals the presence of extra-solar planets is the measurement of a star’s brightness in the photometric channels.
There are two ways to exploit photometric data for planet detection: A tell-tale dip in the brightness of a star indicates a transit of a planetary companion in front of it. While this dip is tiny compared to the total brightness of the star, the sensitivity of Gaia’s instrument is sufficient to detect it.
The other mode of planet detection by brightness measurement is searching for a micro-lensing event. When a foreground star moves in front of a background star as seen from Earth, the background star increases in brightness due to the relativistic bending of light rays by the foreground star; this effect is called a gravitational lens.
Sometimes the geometry of the transit is just right, so that the brightness peak exhibits a secondary, much more narrow peak next to it. This micro-lensing event is interpreted as the result of the presence of a planet.
Gaia thus has four independent ways to detect extra-solar planets: radial velocity, plane-of-sky velocity, planetary transit, and micro-lensing. We do not know, yet, how many and what kind of planets we will detect with Gaia, but we do know that the shear amount of data will provide a huge leap in our understanding of the population of planets in the Milky Way.
Preparing the ground for Gaia
On top of the science and engineering that goes into a mission like Gaia, there is also the challenging aspect of mission design.
Mission design means that the science requirements and system constraints must be translated into a functioning mission – that is, a sequence of operations along a trajectory in space and time. Because mission design has so many interfaces to all components of the system, it is subject to a strong evolution during the satellite development phase.
For Gaia, the challenge was to identify an orbit having a very constant thermal environment, low radiation exposure and high accessibility to the sky. A libration orbit around the night-side Lagrange point of the Earth-Sun system is the standard answer to this set of requirements – and it suits Gaia just fine.
However, in order to fulfil the extreme stability required to achieve the necessary level of astrometric precision, it was not possible to place a steerable high-gain antenna on the spacecraft (so as to transmit the huge data volume across the 1.5 million kilometres that separate L2 from the Earth). The solution was to use a small-amplitude Lissajous orbit around L2 that would guarantee an angle between the Sun and Earth as seen from the spacecraft of below 15 degrees. This made it possible to use a smaller on-board phased-array antenna that can be steered electronically towards Earth while Gaia is spinning.
Mission analysis means solving problems
This also means that we lose the high-speed data link if Gaia would ever leave the 15-degree cone around the L2 point.
The downside of the small amplitude orbit is that a manoeuvre of approximately 160 metres per second (depending on launch date) is required to get there. Everybody can imaging that a spacecraft that has a high-precision telescope on its back is not the most manoeuvrable vehicle; this is true for Gaia as well, so many compromises had to be made between the development phase and the launch phase.
For example, in the development phase, a thruster was placed sideways on the Gaia bus, because it was known that the injection into the small-amplitude orbit about 35 days after launch would have to occur sideways relative to the Sun-Earth line.
As it turned out, when moving into preparations for operations, the precision of the side-engine was found to be insufficient, mainly due to the effect of the shift of centre of mass caused by the fuel moving about in the tank. In the end, the use of the side engine was severely limited and compensated by a less optimal but more safe manoeuvre.
Another challenge was faced when the ability of the ground-stations to acquire the signal of the satellite for the first time after launch was analysed. Due to the very small width of the antenna beam in the high frequency X-band utilized by Gaia, it was possible in an extreme scenario that the deviation coming from the launch vehicle would lead to a situation where the ground station could not detect the signal. Again, the mission design and ground segment teams at ESOC put their brains together to find a solution, which was put in place and validated in record time.
In many operational aspects Gaia, is a mission like many others: a lot of surprises with a lot of good solutions. When it comes to the science, Gaia will be unique. Even more than Hipparcos, will Gaia shape the way we understand our home in the cosmos: the Milky Way.
When Gaia lifts off in October this year from the European Spaceport in French Guiana, it will be the continuation of European astronomical tradition at its best: exploring the skies for more than five hundred years. (And ol’ William would have been delighted to see this mission being flown from ESOC, located in his beloved Hessen! – Ed.)

Discussion: no comments