James Godfrey is working this morning in the Mars Express dedicated control room at ESOC and he’s sent in this update.
[10:32 CET] NASA DSN have reported that they collected good data at their Madrid 70m station during the flyby and saw “a slight effect in the Doppler residuals, as expected.” This slight effect is caused by the gravitational field of Phobos accelerating the Mars Express spacecraft as it flies past the moon and is the signal that we are trying to measure! NASA DSN are now receiving signals from MEX via their 70m dish at Goldstone.
Now it is up to the radio scientists to examine the measurements made on the radio signals and to determine the effect of the uneven (non-spherical) mass distribution of this oddly shaped moon, Phobos, on Mars Express.

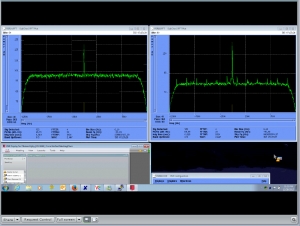
This is a screen shot from a spectrum-analyser display at NASA’s 70m DSN station in Madrid (as received at ESOC). The left-hand panel shows the S-band channel and the right-hand shows the X-band channel.
View of the signal strength coming from MEX as received via
NASA’s 70m antenna at Madrid, just after closest approach


Discussion: 10 comments
Is the power in dBm (for example, -130 dBm)? If so, why is the power scaled like this? Thanks for your answer!
Great job with MEX and Phobos! 😉
Hi Dominique: This response was provided by James Godfrey, one of the MEX operations engineers at ESOC.
— Daniel
========== Screenshot details
This is a screen shot from a spectrum-analyser display at NASA DSN. The left-hand panel shows the S-band channel and the right-hand shows the X-band channel. The scale is in dBm. This is a convenient measure of power allowing both large and small values to be expressed in a short form that can be displayed in a single graph. In each graph we can see the background noise at
around 98 and 85 dBm and the peak in the middle of each panel is the signal from the spacecraft. Cheers!
Hello, congratulation to all the team for the amazing passage. Just for curiosity, what was the approx speed of Mars Express ?
Hi Massimo,
It was a few km per second. Compare this to the ISS in orbit around the Earth: that’s about 7 km/sec.
— Daniel
Thanks Daniel and James for your answers!
Concerning the power level, I understand the need of a dBm scale, but not the level shown itself. For example, 120 dBm seems very, very strong (and unrealistic) for a signal received after a travel of several millions of kilometers. So, in addition to the receiver gain (antenna, LNA…), I presume there is some sort of “artificial” dB-gain for a practical, visual reason, isn’t it? Say, a gain of 260 dB, which leads to: -130 dBm+260dB=~+130 dBm (the approximate power we see on the display). This being done for a better vizualisation (positive numbers) at screen.
I am wrong?
Thanks for your answer again! 🙂
Hi Dominique,
The MEX team at ESOC sent in this reply:
The display was provided to us by NASA (via a Web share), so that we could see a confirmation that the spacecraft carrier signals were being received at Madrid. As we don’t know where these signals were measured in the reception chain, we can’t comment on the absolute values measured. However, the values displayed do make it look as though they have been raised so as to remove the path loss (the loss in received signal strength due to distance). As the Earth-Mars distance can vary from about 50 to 400 million km, this would make it much easier to compare two signals recorded at different times. Or it simply could be that the spectrum analyser was measuring the signals after they had been amplified and the displayed levels were not corrected for this amplification.
A fuller reply would have to come from our NASA colleagues. Hope this helps!
The Y axis definitely isn’t dBm — these values are normally negative, and grow larger in (negative) magnitude toward the bottom of the plot. Looks like the axis is in positive dB relative to something that’s meaningful at the receiver or monitoring site.
A gain of 260 dB is about what it takes to go from a whisper to a supernova. 🙂
After “a slight effect in the Doppler residuals” is possible to determine accurately the mass of Phobos?
Thank you in advance
I think the ESA team uses a relation between acceleration experienced by the spacecraft, Phobos mass (Newton’s law) and frequency shift observed on the carrier which creates a slight, very small (but measurable) Doppler effect. The frequency shift is caused by the acceleration of MEX. But this is certainly more difficult since the spacecrafts evolves in a 3-D environment, so there are three accelerations to take into account (I think).
Hi Ivan,
Our project scientist, Olivier Witasse, provides this reply:
Yes, indeed, even with this small Doppler shift, the mass of Phobos can be determined very accurately – with an uncertainty much better than 1%. With this very close flyby, we want to achieve even better, and to estimate the so-called J2 coefficient that will tell us how the interior of Phobos is structured.