


Introduction from: Rudy Castorina (Ocean Media Lab) & Craig Donlon (ESA)
As the Ocean Training Course continues its southward journey, the integration of satellite observations with hands-on science is very much alive. Through student-led presentations and collaborative learning, a wonderful moment unfolded when Brishan Kalyan shared how they have been connecting satellite imagery with in-situ water samples – highlighting microscopic lifeforms, phytoplankton, that form the base of the ocean food web.
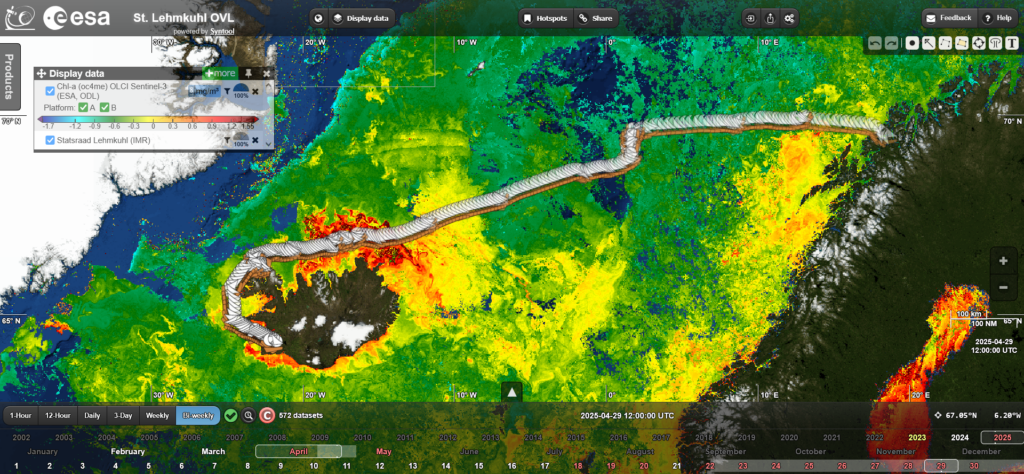
Sentinel-3 Chlopphyll-a data overlaid with the route from Tromsø to Iceland. As the ship traces its way through the North Atlantic bloom, a high concentration of chlorophyll (in red) reveals thriving phytoplankton populations captured from space. This snapshot coincides with in-situ sampling stations where Brishan and fellow students collected water samples to cross-reference biological diversity against these vivid satellite patterns. (Ocean Virtual Lab)
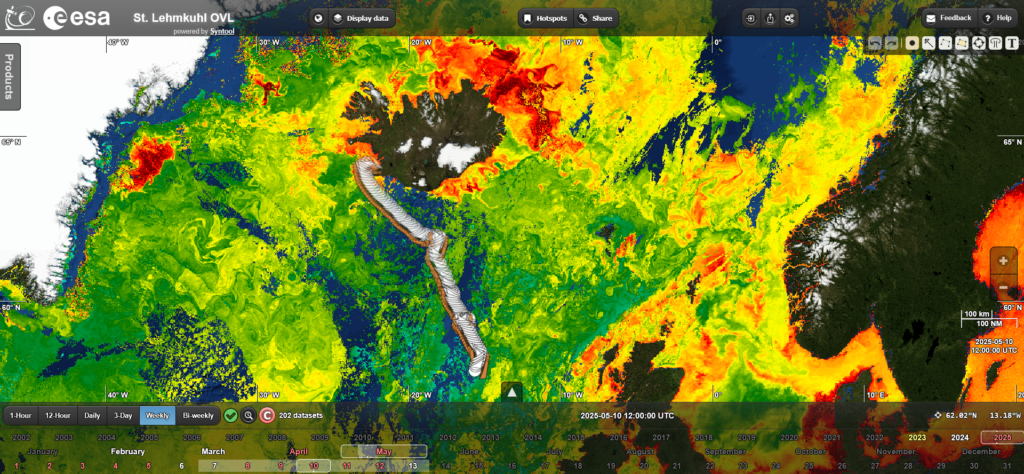
Phytoplankton mosaics between Iceland and the European shelf edge. During this leg of the journey, satellite imagery shows fluctuating chlorophyll levels across complex eddy structures. These dynamic features helped guide onboard sampling and gave students like Brishan the chance to visually correlate microscope imagery of phytoplankton with remote sensing data – turning pixels into living stories. (Ocean Virtual Lab)
This exciting presentation exemplified the mission’s goal: empowering early-career scientists to read the ocean’s pulse from both space and sea, using tools like the Ocean Virtual Laboratory and spectacular images from Copernicus Sentinel-3’s Ocean and Land Colour Imager, while fostering a deeper understanding of ocean biodiversity.
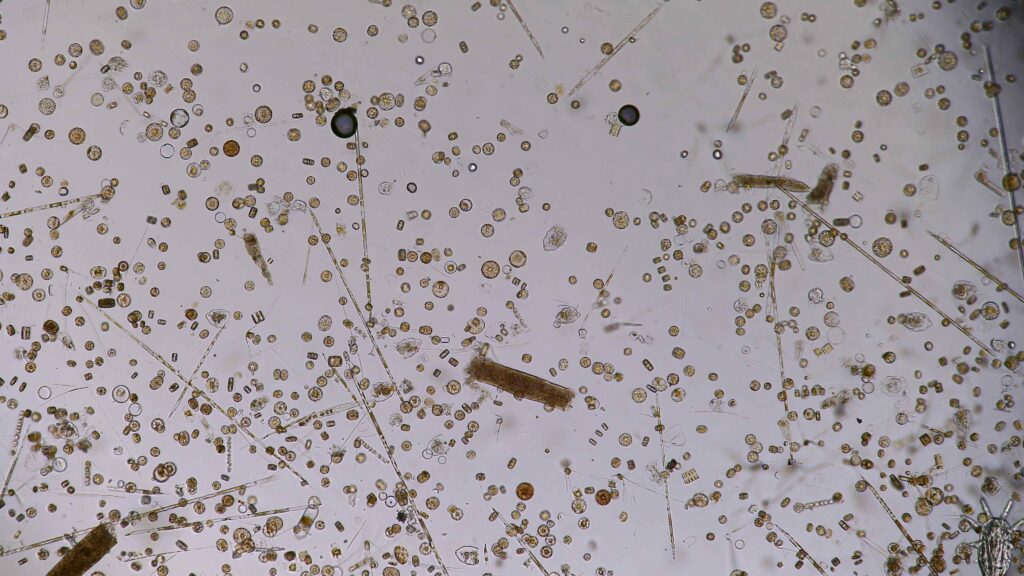
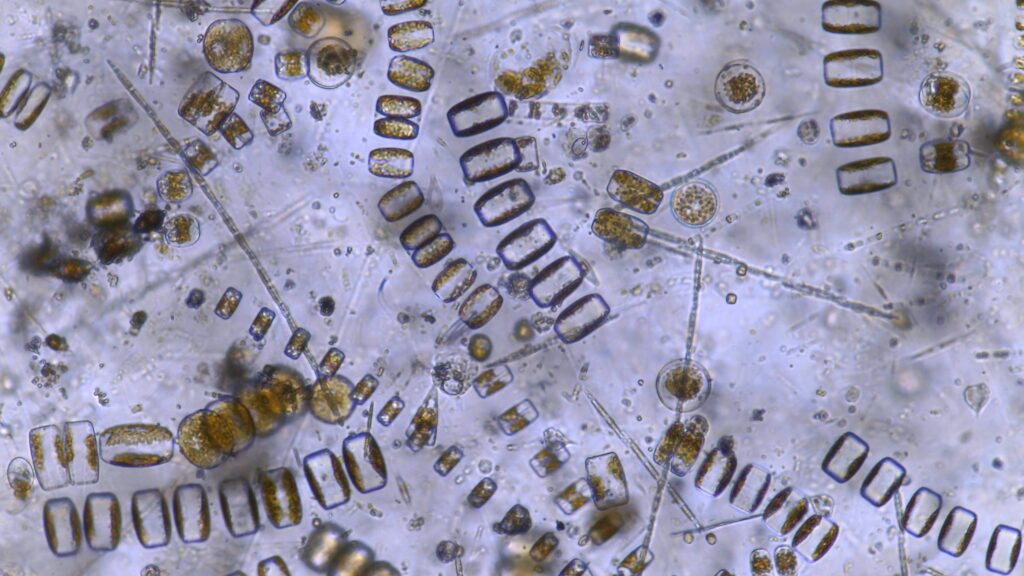
Station 8: Phytoplankton diversity showing a majority of single centric diatoms with few pennare species.
Here’s what Brishan Kalyan (South African Environmental Observation Network and Nelson Mandela University) had to say:
I had the great opportunity of presenting some of the phytoplankton found while on board. I presented a variety of images and videos taken on the Curiosity microscope for each of the stations sampled since leaving Tromsø to halfway to Nice. I tried to show the changes in community diversity between each of the stations and the association to the satellite data captured during cloud-free days.
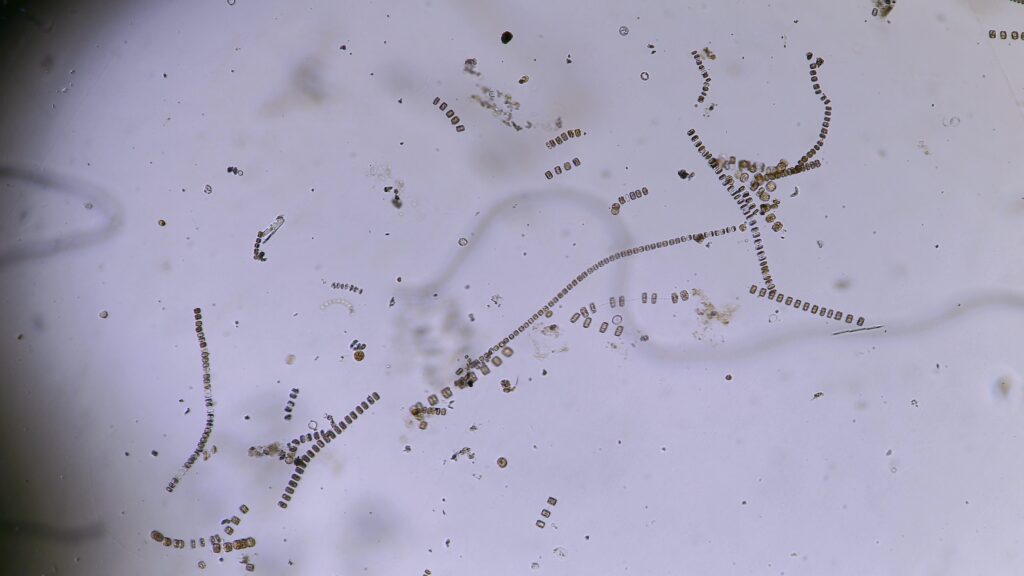
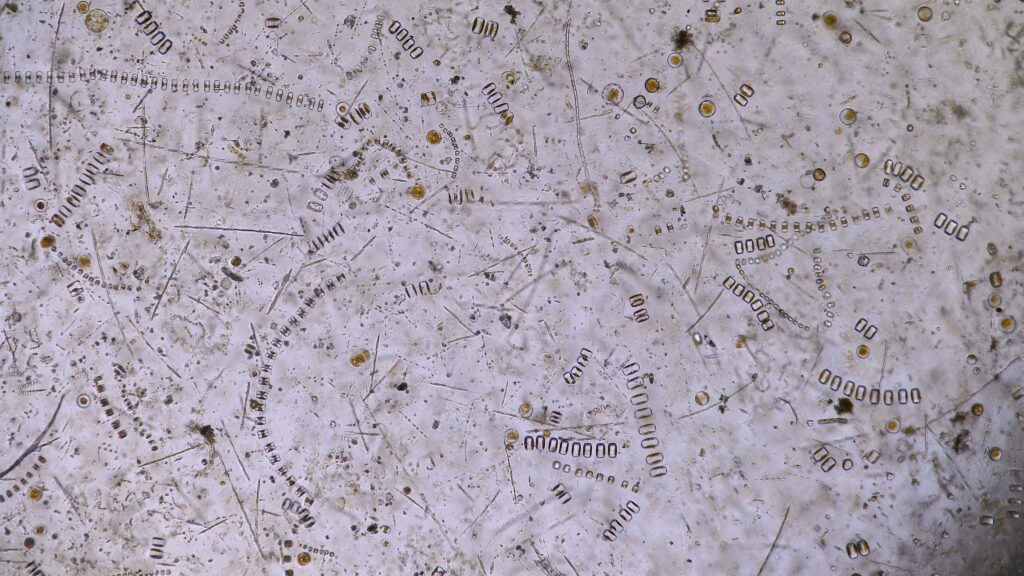
Station 9: Chain forming diatom Thalassiosira found at the station.
Station11: Phytoplankton seen with the Curiosity microscope – phytoplankton inside a fjord.
Station 11: High-density phytoplankton sample within a fjord showing both chain-forming centric and pennate diatoms.
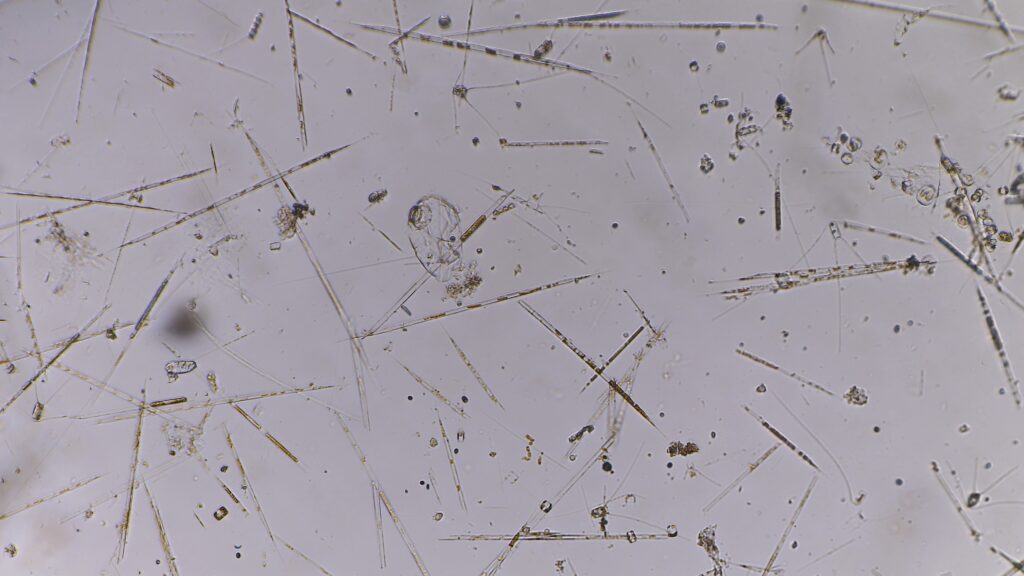
Station 12: Pennate diatoms, Pseudo-nitzschia and Rhizosolenia spp with a few centric chaetoceros spp.
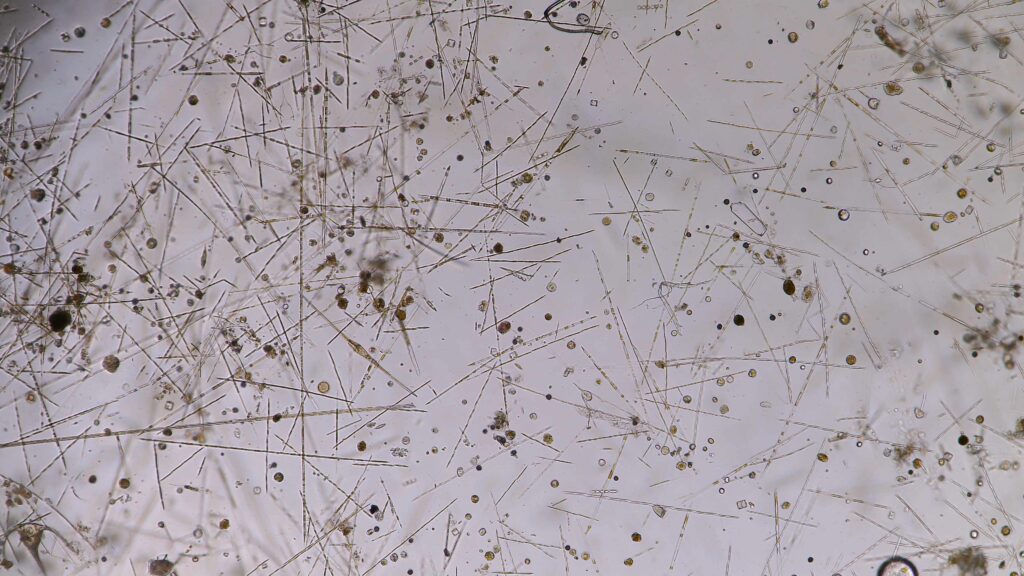
Station 14: High-density pennate diatioms and a few centric diatoms with the appearance of dinoflagellates.
The feedback from everyone was amazing and many questions were asked as to the roles, types and reasons we find such different types of phytoplankton. I had a great time presenting this work, but I must say it was one of the hardest presentations I have had to give. This was because it was just about images of phytoplankton – no graphs and no results, but rather just a photo montage of how one can see some of the changes from the raw data.
I would like to take this opportunity to thank all my sponsors (ESA, NASA and SAEON) for this great opportunity and amazing learning experience, only great things can come from this and I hope to have encouraged others on board to have a look at phytoplankton from time to time, and to garner more interest in their identification.
Discussion: no comments