The first results from measurements taken on the ice during the CryoVEx campaign show that the sea ice between Canada and the North Pole continues to get thinner.
One of the objectives of the CryoVEx campaign was to observe how snow and sea-ice thickness varies along a CryoSat track from the coast of Canada across the multiyear ice zone into the first-year ice further north.
A week after this part of the CryoVEx campaign was completed, data processing has progressed and we can present some first results. These will be invaluable for CryoSat and IceBridge data processing by the various data product groups, for assessment of the state of Arctic sea ice after an exceptionally warm winter, and for initialising predictions of summer ice conditions.

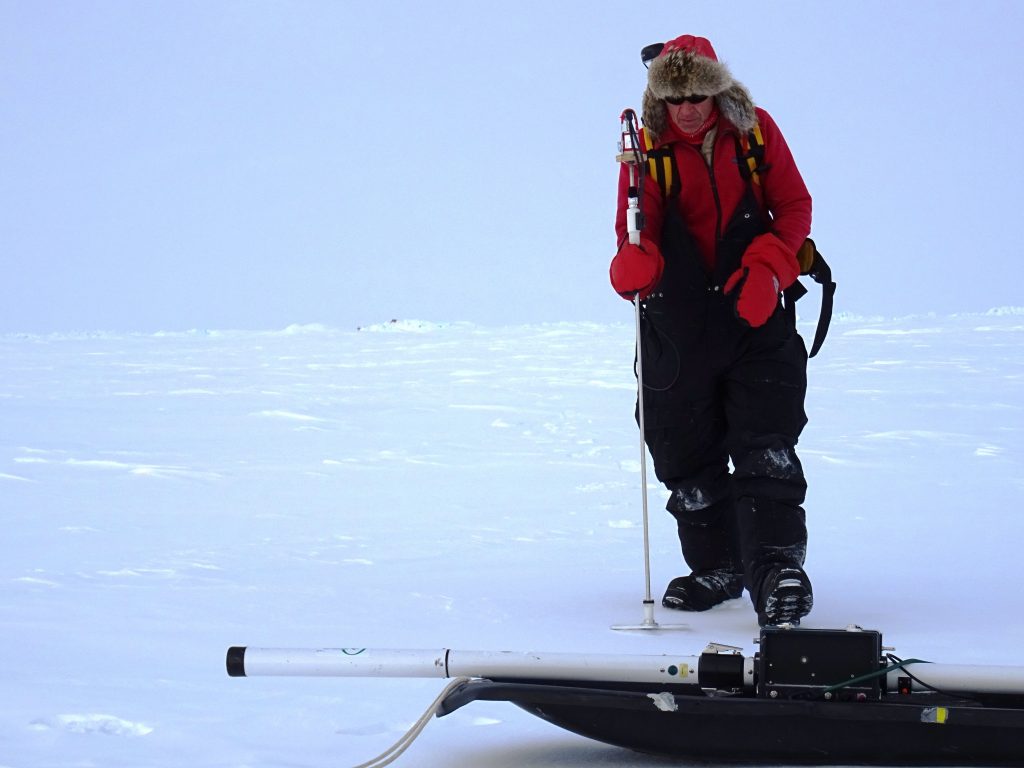
Arvids Silis making snow thickness measurements with a magnaprobe. The EM sled in the foreground and the tail tip of Twin Otter is in the far distance. (C. Haas)
At 12 Twin Otter landing sites between 83N and 87.1N, we gathered 36.7 km of electromagnetic (EM) ice- and snow-thickness data and acquired some 13 000 snow-thickness measurements. EM soundings were calibrated with drill-hole measurements. Data were edited to remove any bias due to thinner snow and ice conditions in the immediate vicinity of our landing sites, which were mostly on refrozen leads. Our results represent conditions on thick, old first- and multiyear ice floes typical for the wider regions around the landing sites.

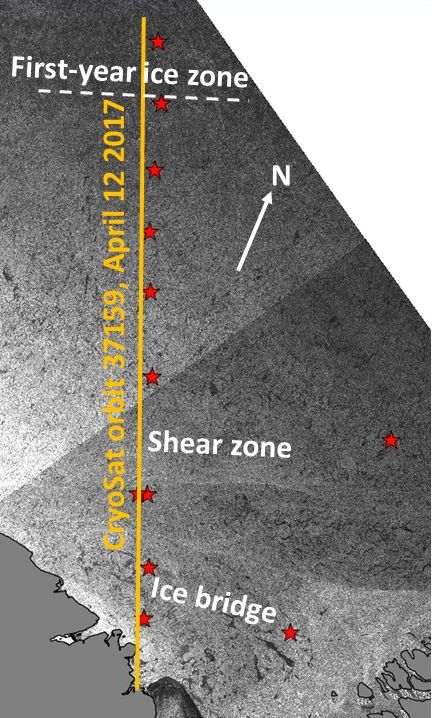
Sentinel-1 radar image of the study region showing the study sites (red stars), CryoSat orbit 37159, and characteristic ice features. (contains modified Copernicus data (2017)/York University)
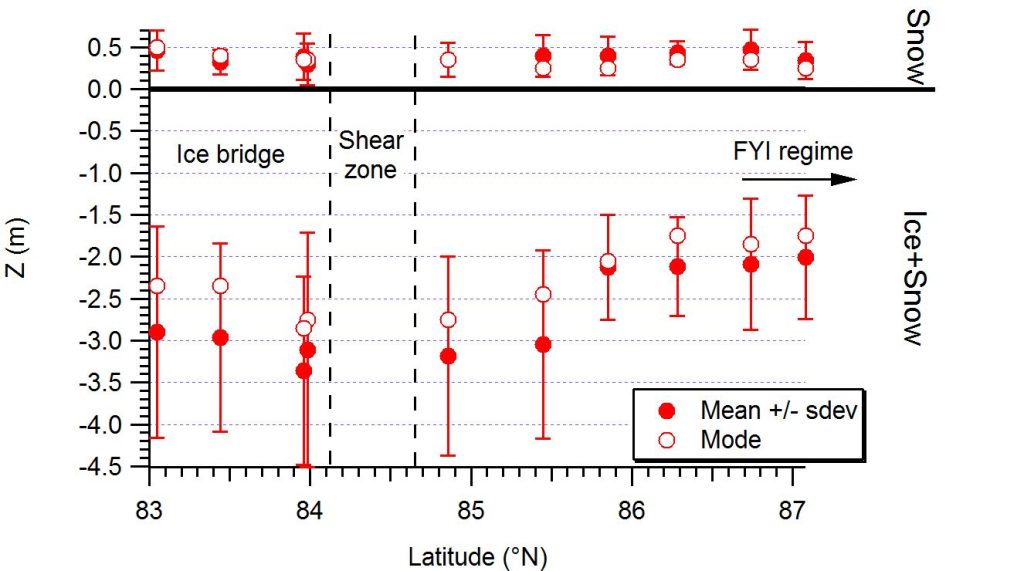
The figure below shows that mean ice thicknesses ranged between 2 and 3.4 m. The thickest ice was found in the vicinity of a prominent shear zone between an ice bridge in the Lincoln Sea (between Ellesmere Island and Greenland) and mobile pack ice to the north. The thinnest ice was found furthest to the north, representing second- and old first-year ice. The results show that the objective of fully crossing the multiyear ice zone was successfully met.

Ice and snow thickness measured of 10 ice floes along CryoSat orbit 37159 (see map above), from south (left) to north (right). Error bars show +/- one standard deviation. Ice thickness is plotted with negative sign, illustrating approximate sea-ice draft. Note that ice thicknesses were derived by EM sounding and actually represent snow-plus-ice thickness. (C. Haas)
Modal thickness is the most frequently occurring thickness representative of thermodynamically grown level ice. It ranged between 1.8 and 2.9 m, including 0.25 to 0.4 m of snow (see below). The multiyear ice thickness was little different from measurements at the same latitude during previous CryoVEx campaigns in 2011 and 2014.
It was 0.2 m thinner than in 2014, but of the same thickness as in 2011. Second- and first-year modal ice thicknesses ranged between 1.8 and 1.9 m. This is thinner by 0.2 m or so than may be expected from previous airborne measurements, which indicated second- and first-year ice thicknesses of around 2.0 m in the same region. There are no representative in situ measurements to compare with.
The observed thinning is less dramatic than may have been expected from the observed, widespread higher air temperatures in the 2016/17 winter. It is possible that the relatively thin snow cover at the northernmost station (mean (modal) snow thickness 0.34 m (0.25 m)) has compensated for the effect of warmer air temperature by allowing more ice to grow despite warmer air temperatures.
The top portion of the figure shows that in contrast to the ice, snow thickness varied strongly and no spatial trends were observed. Mean and modal snow thicknesses ranged between 0.3 to 0.47 m, and 0.1 to 0.5 m, respectively. On average, the snow thickness standard deviation at each site was approximately 50% of the mean thickness.
Even with thick snow conditions, bare shallow hummocks without significant snow cover did frequently occur. Average snow thickness was within ±0.05 m of the Warren snow climatology, but with strong site to site and local variability.
The CryoVEx ground team (please contact us for data access):
Christian Haas (AWI/YorkU)
Justin Beckers (UAlberta/YorkU)
Josh King (ECCC)
Arvids Silis (ECCC)
Julienne Stroeve (UCL/NSIDC)
Jeremy Wilkinson (BAS)
Post from Christian Haas (York University, Canada)


Discussion: 2 comments
Two questions please:
— We know that the ice above the shear zone did not form there but instead along various trajectories taken over during the fall and winter. Are not the applicable temperatures those along the 1000’s of km trajectories, not the winter temperatures along the fixed transect, possibly invalidating your conclusion of ‘more ice’ than expected?
— Is the ice consistently thinner than those calculated by Piomas and how does this affect whole ocean volume?
1. Yes it is correct that the ice moves a lot which complicates interpretation of thickness changes, in particular of multiyear ice which has drifted the furthest and has undergone several growth and melt seasons. It is easier for first-year ice. However, our general statement about warmer Arctic air temperatures concerned the whole Arctic, and therefore ice growth in the central Arctic Ocean will have been a little less then usual everywhere.
2. Our data cannot easily be compared with Arctic-wide estimates of thickness or volume. I am not sure what PIOMAS shows in our study region. However, PIOMAS is only a model. Hopefully it can be validated with our data. Due to the limited regional coverage of our study we cannot state Arctic-wide ice volume change. However, very likely, with thinner ice, overall volume will be less too.