Chung-Chi Lin (ESA) & Dirk Schuettemeyer (ESA), 18 March 2013
At the end of February, teams from the Finnish Meteorological Institute (FMI), GAMMA Remote Sensing and the Swiss Avalanche Service (SLF) successfully carried out the SnowScat vertical profiling experiment in Sodankylä, Finland.
The experiment was conducted to gain deeper knowledge about the stratigraphy of snow. It is part of the activities of ESA’s CoReH2O (Cold Region Hydrology High-Resolution Observatory) candidate Earth Explorer 7 satellite.
The instrument worked perfectly during the experiment. The scientists were also happy since the data that were collected as they looked very representative.
Developed by GAMMA in Switzerland, the ‘SnowScat’ instrument is a fully polarimetric scatterometer, coherent stepped-frequency continuous wave radar that operates in the range of 9–18 GHz.
SnowScat has been used in the last four winters in Sodankylä and produced a wealth of data for analysing snow mass, snow structure and snow-pack morphology such as stratification, grain size and type.
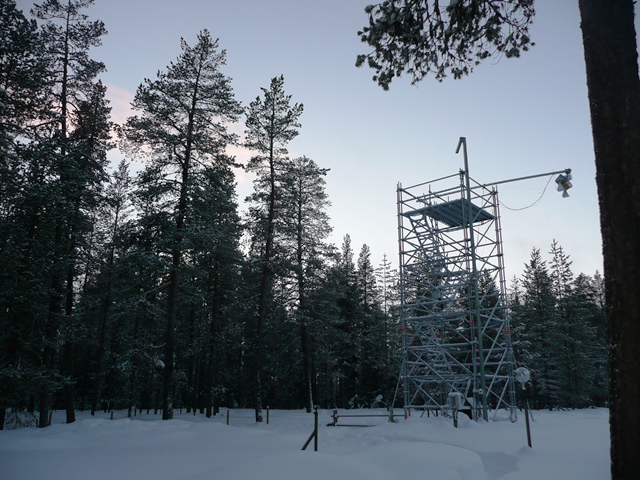
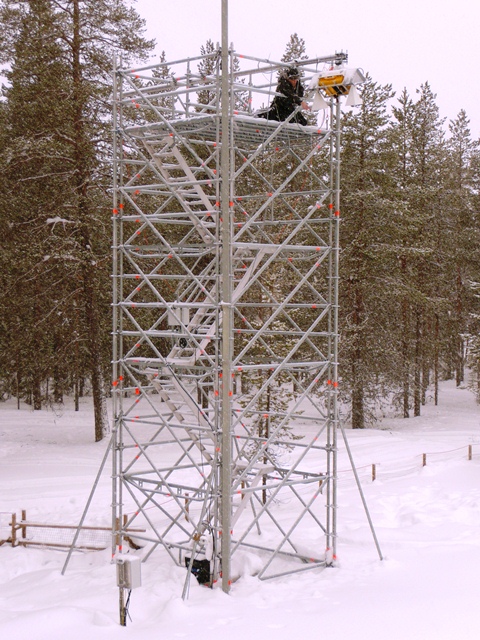
Until this part of the campaign the instrument worked with a similar viewing geometry as a potential satellite. However, it was the time to change this to have a closer look at the layering of snow. This involved some basic construction to move the instrument around, as you can see below.
The campaign had good start since the weather and snow conditions at the time were rather favourable. The temperature rose to above freezing in the days preceding the experiment, causing partial surface melt. During the experiment, temperatures remained around freezing, so the hope was that some nice layering could be observed.
On the first day of the actual experiment, it snowed from the early morning until just after the mid-afternoon. It took the team the whole morning to set up SnowScat in these challenging conditions. Initially, the team couldn’t mount a functioning laser pointer on SnowScat, which obtains a rough pointing knowledge of the instrument.
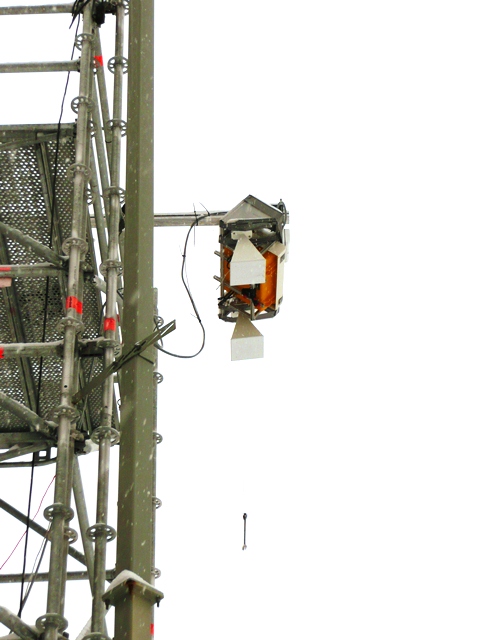
Nevertheless, the team used their creative skills to attached a string with a weight (actually it was a wrench) to determine the true vertical direction. The antennas of the instrument were then visually aligned with an accuracy of better than say half a degree.
Owing to the heavy snowfall, there was a rapid accumulation of snow on the instrument. The meltwater dripped from SnowScat and created small indents in the surface of the snow on the ground. We don’t know yet what effect this will have on the SnowScat signatures.
On the second day, the sky was mostly clear, and it didn’t snow.
For the actual data acquisition, the extension beam was swung manually around a pivot point at back of the instrument. SnowScat was then operated at 11 different positions along an arc of approximately 2 m.
The geometry is determined by the marks on the front-side railing as seen below. This string with the weight, i.e. the wrench turned out to be very useful, as it could be extended so that the weight was lowered at the end of the experiment to mark the nadir points on the snow surface for the snow-pit characterisation.
At each horizontal position, SnowScat was operated at five elevation angles, from –2° to +2°. At each elevation angle, it swept the maximum frequency range (9.5–17.5 GHz). It was determined that the responses were not so sensitive with respect to the precise pointing around the vertical.
At ±2°, the first peak became noticeably reduced, whereas the ground return remained comparable, which confirmed the assumption on the dominance of specular reflections from the snow surface and internal layers.
The team had to climb up the tower every time the extension beam was swung horizontally, but this helped to keep them warm! The first set of measurements from all the horizontal positions was completed by the end of the first day.
The same measurements were repeated in the morning of the second day. So, we now have two complete sets of measurements with two slightly different snowpack conditions, one during snowfall on a partially melted/slightly refrozen surface and the other on fresh snow layered on refrozen snow.

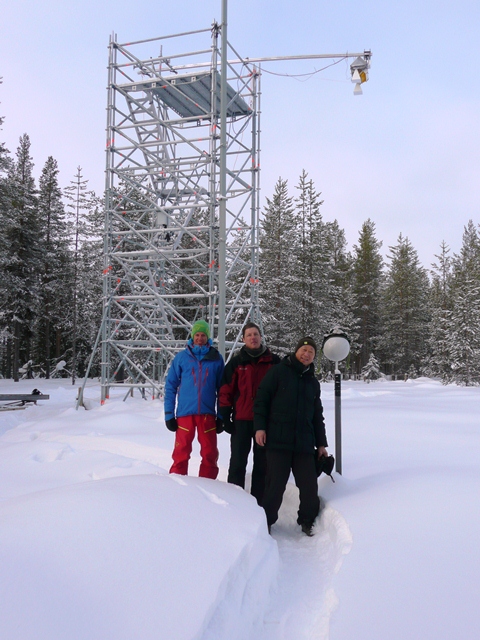
SnowScat on tower with Sebastian (SLF) on left, Andreas (Gamma) in the middle, and Lin (ESA) on the right.
This is already an unique dataset in itself. To be able to really analyse the radar data and also be able to validate the data, the SLF team carried out some extensive in situ data sampling in the field of view of the instrument after the radar data acquisitions.
The different teams have returned home and started to analyse the data and can hopefully report on these measurements in detail soon.


Discussion: no comments