As part of the on-going commissioning tests, we are happy to be able to report on the first spectroscopy observations made by Gaia.
You will have seen the ‘first light’ images from the early phases of commissioning already, but as part of these activities we have also started taking test spectroscopic measurements of known stars.
While astrometric measurements will determine the positions and motions of stars, Gaia will use spectroscopy to measure key physical properties, such as brightness, temperature, mass, age, and chemical composition.
This is achieved by studying stellar spectra – the fingerprints of stars. Typically, a star’s spectrum includes a broad continuum spanning a wide range of wavelengths coming from the hot gas at the surface of the star. This is then interspersed with dips at specific wavelengths, where cooler atoms and molecules in the ‘atmosphere’ of the star absorb some of the continuum light. Occasionally, brighter emission lines can also be seen. The absorption and emission lines provide an indication of the elements present in the object and under what temperature and pressure conditions they exist.
In addition, the lines can all be shifted from their normal wavelengths – that is, the corresponding wavelength at which the same line is observed in the laboratory – if the star is moving towards us or away from us. These stellar radial velocities can be used to determine the velocity of stars with respect to the Sun, and are therefore essential to understand stellar motions in our Galaxy.
The two plots shown here give an idea of the kind of spectroscopic information that Gaia will return over its 5-year mission.
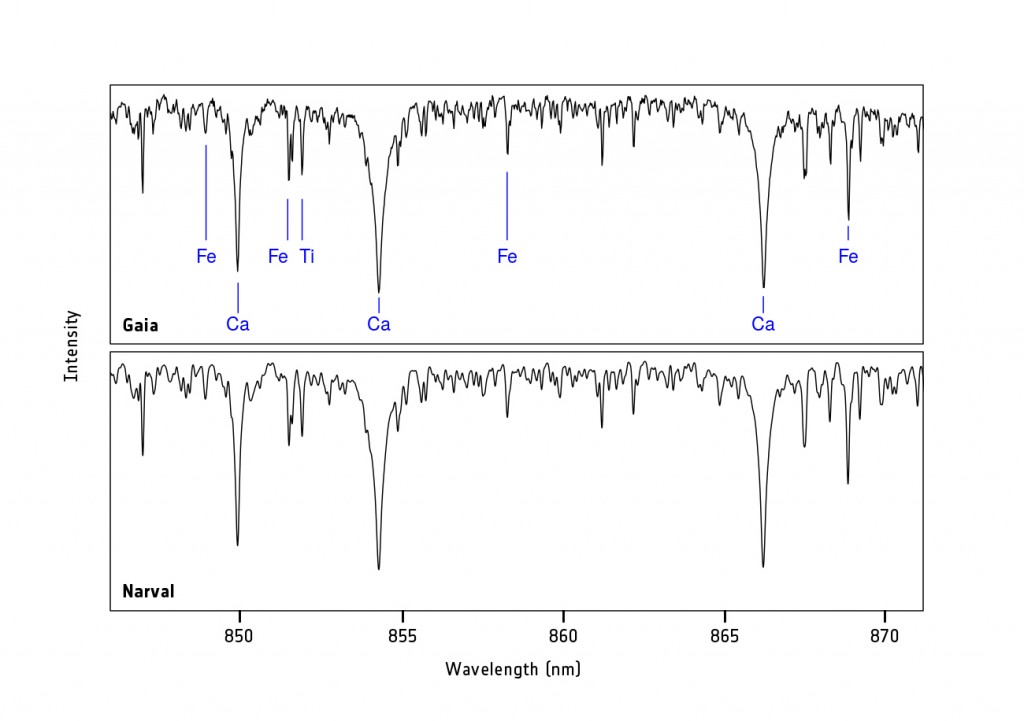
Gaia RVS data (top) compared with high-res ground-based observations (bottom) for the star HIP 86564.
Credits: ESA/Gaia/DPAC/Airbus DS
The first (above) is a radial velocity spectrum for a bright star (HIP 86564), with key elements identified. The RVS only covers a very narrow spectral range at wavelengths centred near 860nm, just beyond the visible red, but provides high enough spectral resolution to make it possible to measure stellar velocities to within a few kilometres per second. The most prominent spectral lines correspond to iron (labelled Fe), titanium (Ti), and calcium (Ca). The ‘triplet’ of calcium lines is particularly important, as they appear in almost all stars. The Gaia plot (top) is compared with high-resolution ground-based observations of the same star, by the NARVAL instrument at the Pic-du-Midi Observatory (bottom), showing that the Gaia RVS is working as expected.
The second plot (below) shows temperature information for seven different bright stars (labelled, along with their spectral types – click here for background on stellar types). This information is extracted from Gaia’s photometric instrument, which generates two low-resolution spectra, one covering blue wavelengths and the other red wavelengths. The blue photometer (BP) receives light with shorter wavelengths (from 330 nm to 680 nm), and the red photometer (RP) receives light with longer wavelengths (from 640 to 1050 nm). The photometers record the total intensity of each star across these wavelengths, and also make it possible to determine the stellar temperatures.
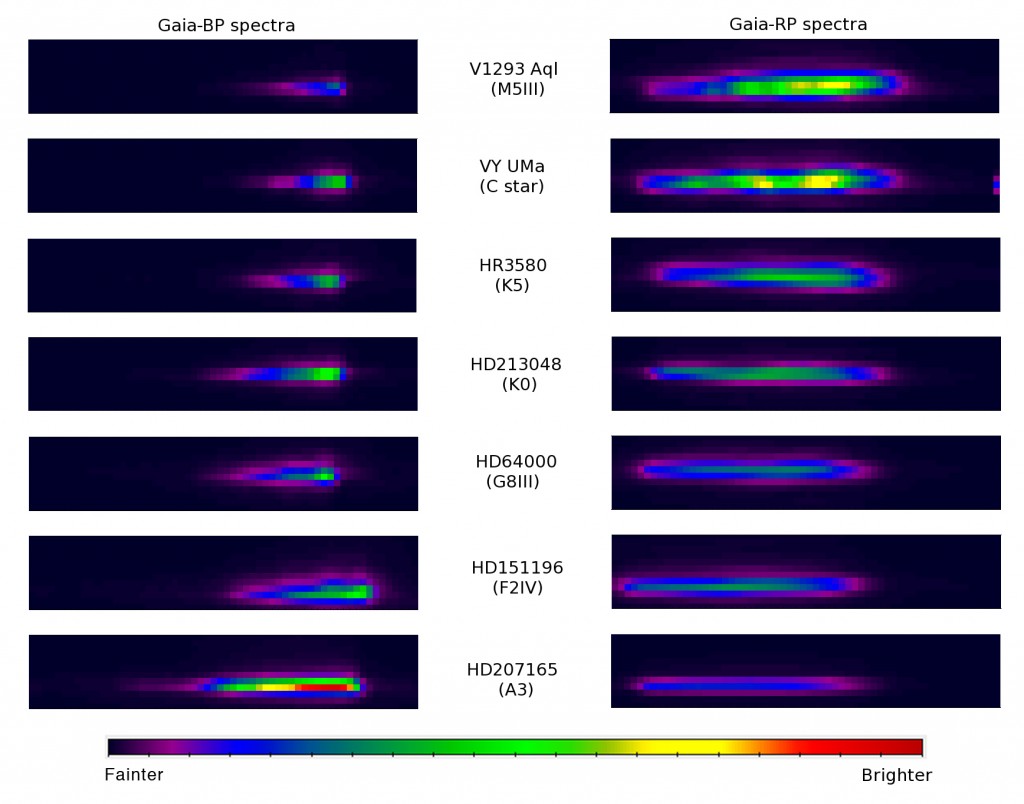
Gaia BP/RP data for seven bright stars.
Credits: ESA/Gaia/DPAC/Airbus DS
A pair of red and blue spectra is shown here for each of the seven stars. The plot is arranged with cool stars (approximately 3000ºC) at the top, to hotter stars (around 8000ºC) at the bottom. As expected, the hottest stars are relatively stronger in Gaia’s blue photometer, and weaker in the red photometer. Conversely, the cooler stars are brighter in the red photometer. Data like these will be used to determine the temperatures for millions of stars in the Milky Way that have not yet been studied in detail.
More details and original spectra are available here.
Within the next few days we will provide an update on the stray light issues discussed in previous blog posts.
Posted on behalf of the Gaia Project Team
Discussion: 5 comments
Superb, especially RVS data seems impressive.
Congratulation for this success !
(and thanks a lot for the comment about stray light info coming soon : it helps to wait, thanks !)
Congratulations to the entire GAIA team for the successful launch, and now, the commissioned observatory!
Thank you for all these infos.
When the next ones? 🙂
Thanks for the info and good job.
Very useful especially if there is possible to determine the radial velocity of stars!