


A short note on what we’ve achieved over the last few weeks for the DOMEX campaign in Antarctica.
The aim of the campaign is to build up a collection of a well-calibrated, multiyear, time series of L-band brightness temperature measurements and infrared brightness temperature over four years to support ESA’s SMOS mission.
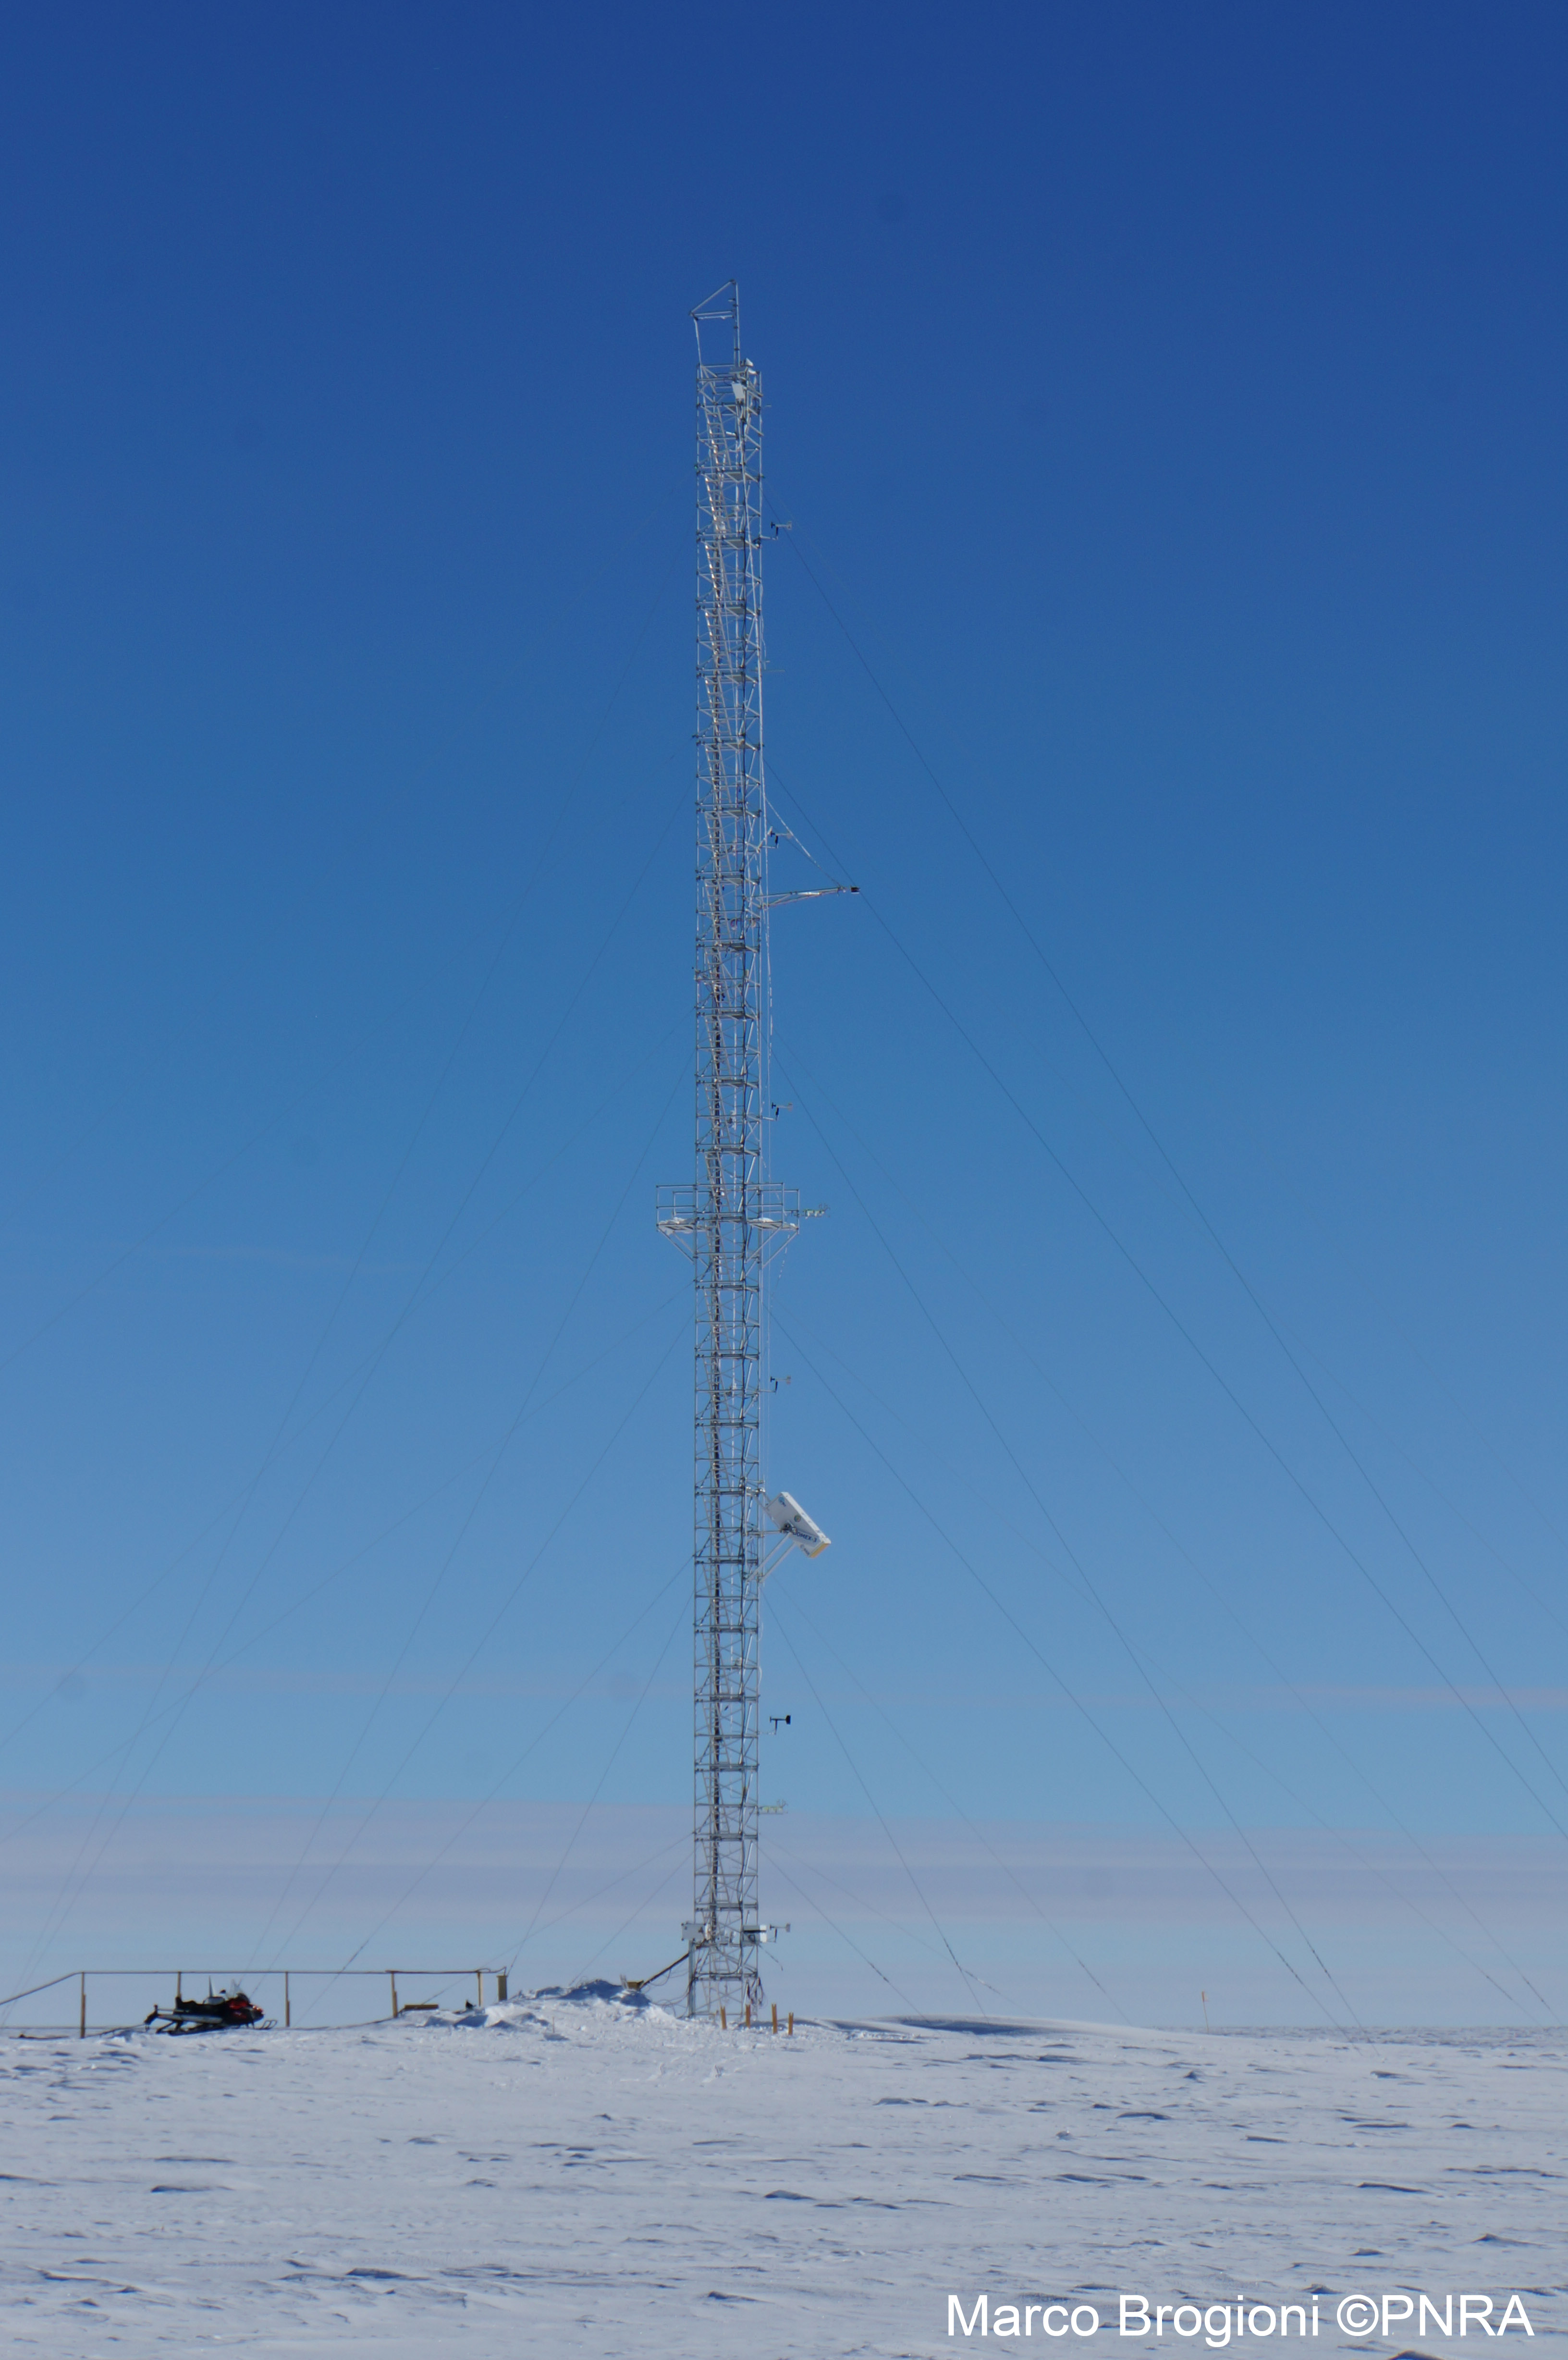
Domex installed on the American Tower looking at the snow surface.
November over the bad weather improved so we could start working longer outside. We had nice sunny days with ‘warm’ temperatures. Spending time in the field was almost a pleasure … we even got a bit of a sun tan.
We started by working on our radiometer DOMEX, which has been continuously measuring the snow cover microwave emissivity since 2012.
Because of the extreme weather conditions at Dome-C there’s a chance of not working properly so we wanted to prevent any possible breakdowns. Doing this kind of maintenance during the Antarctic winter is impossible.
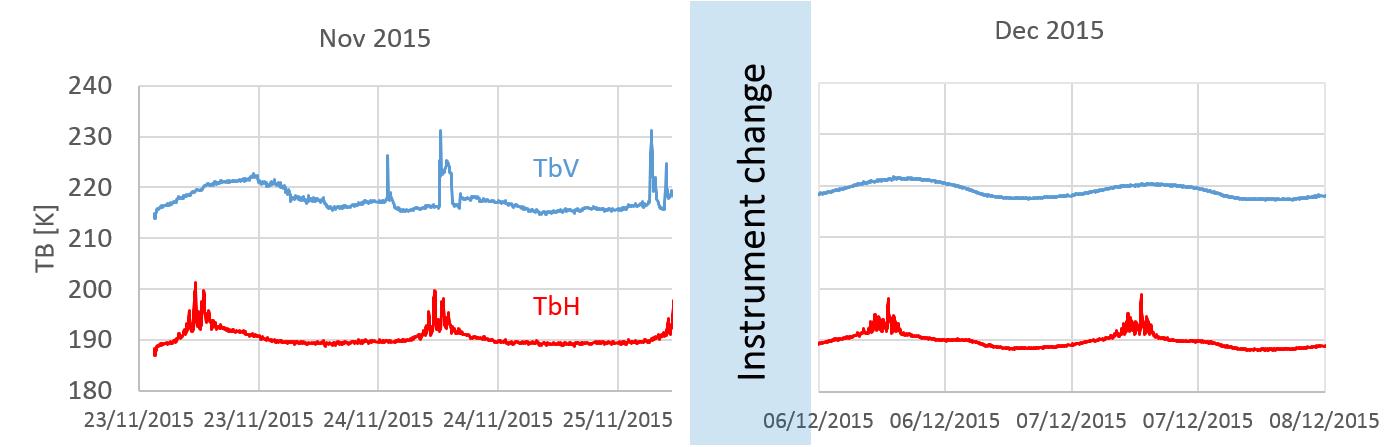
Example of Tb (raw data) measured by RADOMEX after and before RF substitution. Peaks in V polarization (in blue) have been eliminated. Peaks in H polarization (in red) are due to the Sun reflected from the ice sheet surface in the antenna direction.
We changed the radio frequency part of the radiometer and the temperature probes. Right now the instrument is looking down to the snow and collecting data to compare with measurements from SMOS.
RADOMEX data have been elaborated at IFAC laboratories by Francesco Montomoli and the results (see figure above) show that Marco and Fabiano’s work have improved the data.
To keep Fabiano happy we started digging the first snow trench… it was really nice finally seeing him with a shovel in his hands. We measured the snow characteristics along a snow wall 2.5 m long and 1.7 m high. We coupled a classic snow stratigraphy, which is one-dimensional, with near-infrared pictures to follow the lateral variability of the snow cover.
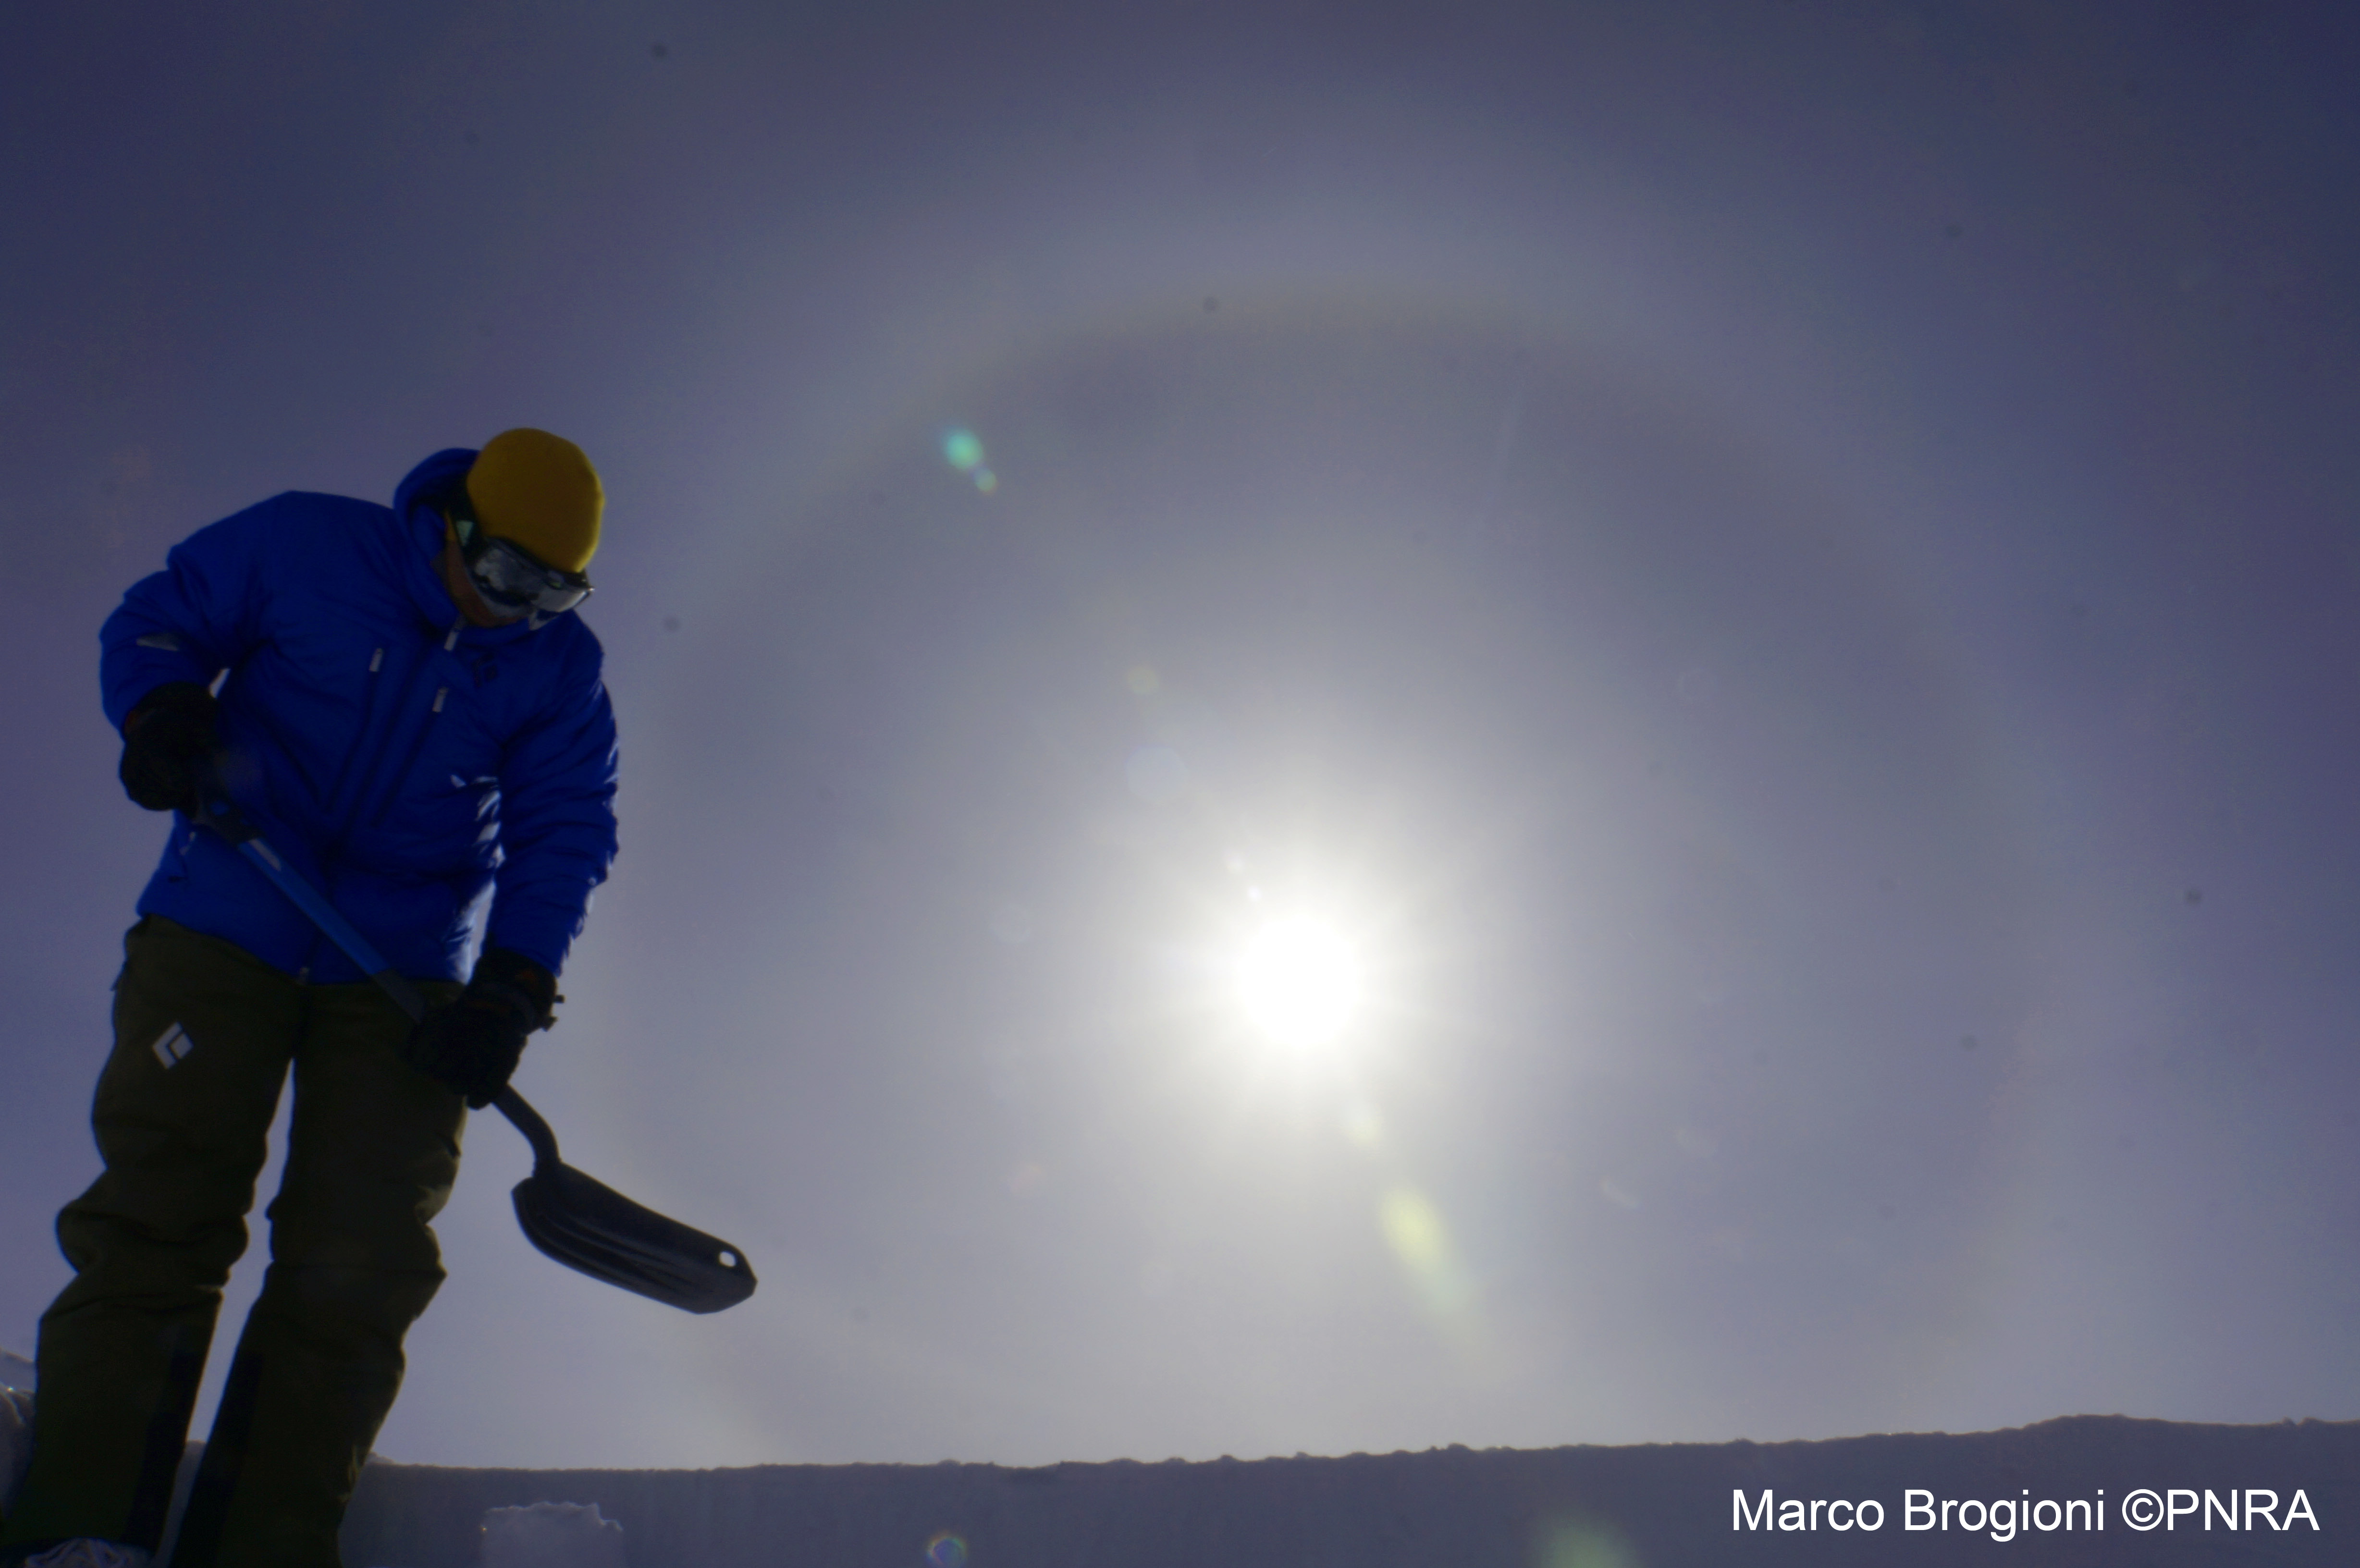
Fabiano working on the snow pit wall to prepare it for the NIR pictures (there was a beautiful halo in the sky).
Usually the snow cover is a bit like a tiramisù (the Italian dessert) – several layers with different characteristics piled one above another. However, in Antarctica this does not happen because the wind strongly affects the deposition, thus the lateral variability of the snow layers is extremely high.
Characterising and measuring these features is very important to properly interpret the signals from the instruments both on the ground and on the satellite.
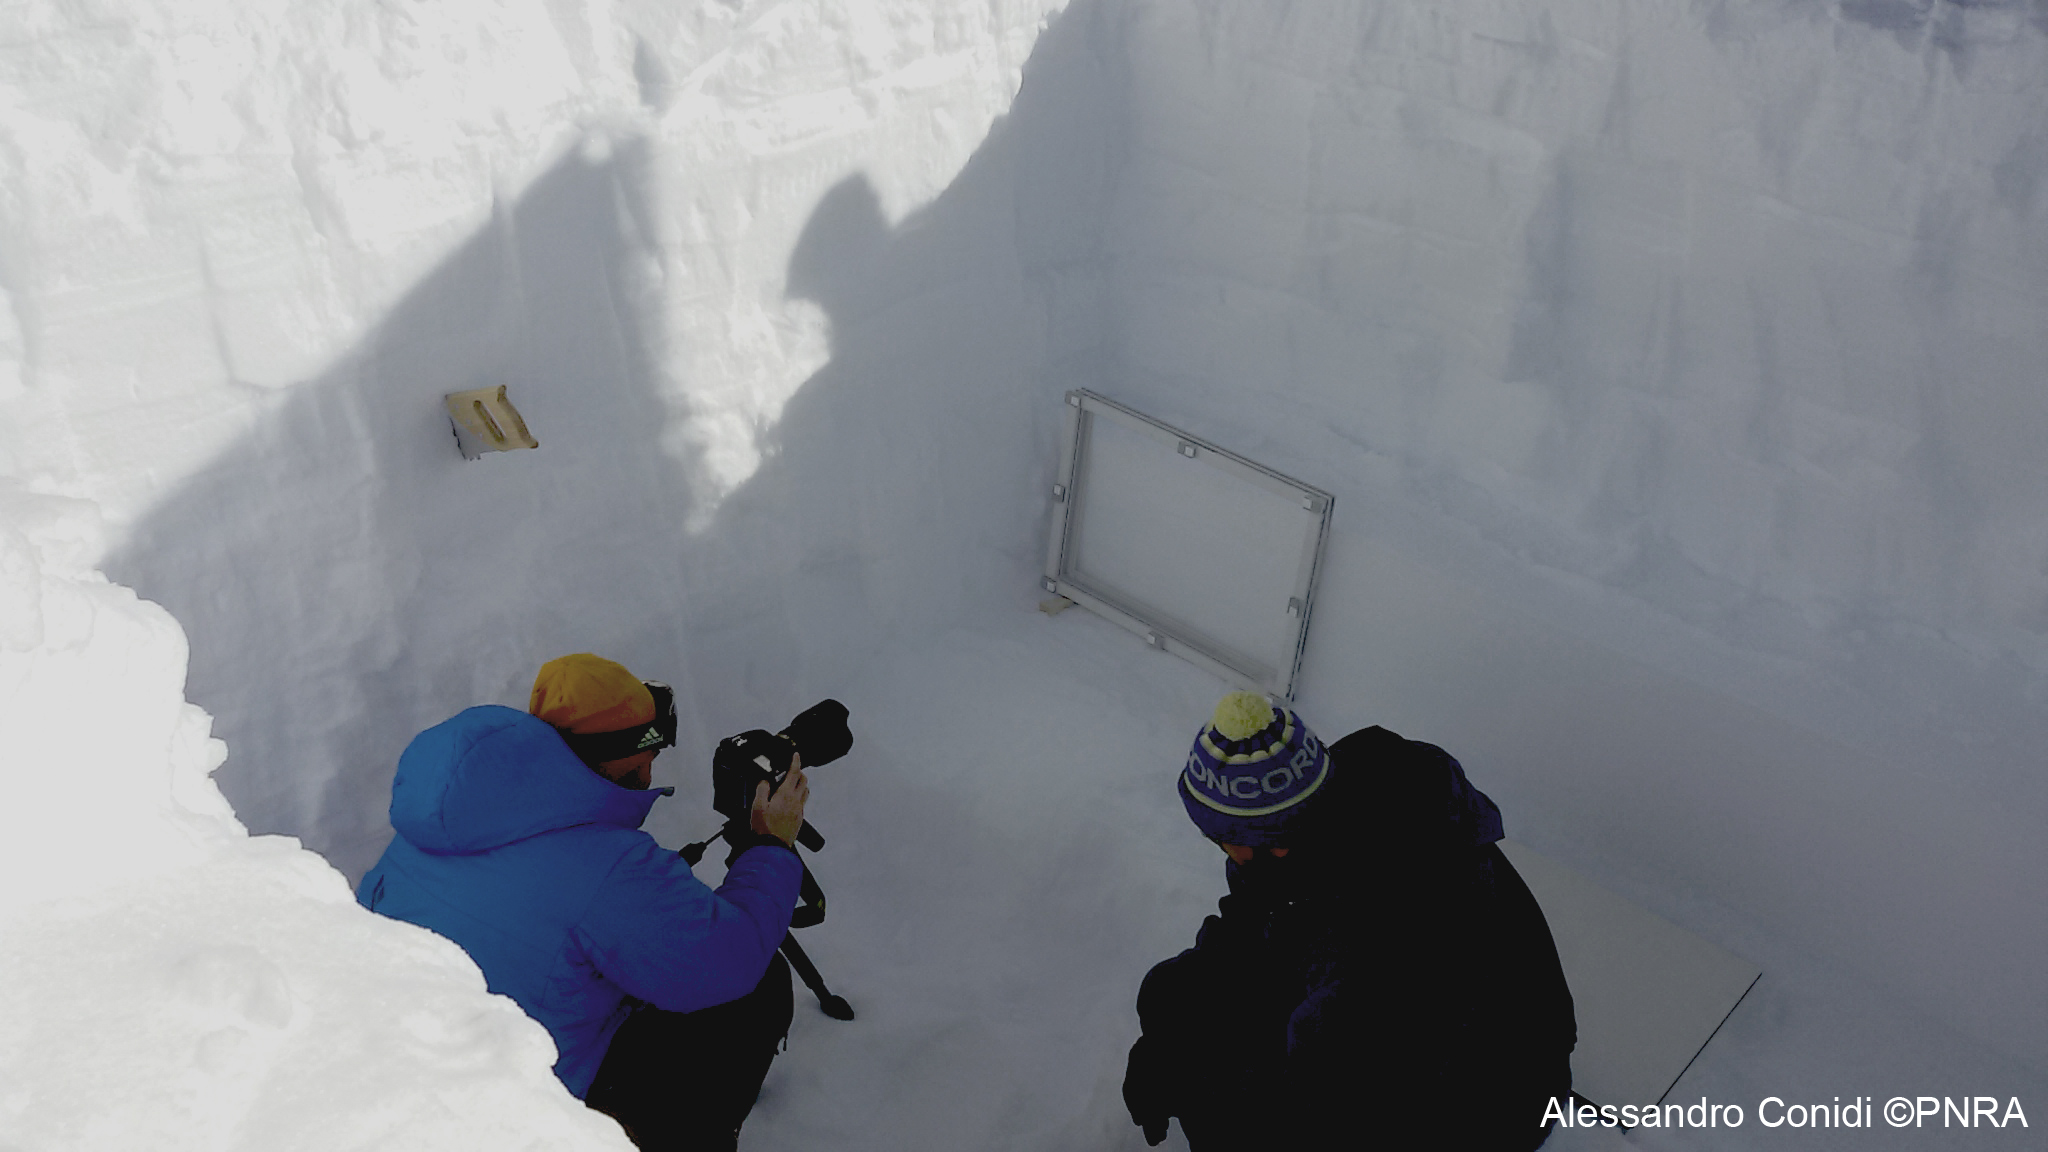
Fabiano (right) and Giampietro Casasanta (DC11 winterover – left) collecting NIR photos of the snow pit wall.
Greetings from the white planet… now we off to dig our second snow trench!
Post from Marco Brogioni (IFAC) and Fabiano Monti (Insubria University)
Discussion: no comments