


CHARADMexp campaign has been supported on daily basis from several modelling services operating at the BEYOND Center of excellence (https://beyond-eocenter.eu/) of the National Observatory of Athens (NOA) and partners such as the Barcelona Supercomputing Centre (BSC) and the UK Met Office. Model simulations and related forecasts that were utilised to consolidate the measurement strategy are described below.
Realtime fire monitoring system based on MSG/SEVIRI (NOA)
Satellite images are acquired every five minutes and are automatically processed to identify wildfire hot spots. The final refined product is at a horizontal resolution of 0.5×0.5 km. This information is provided through an online GUI at NOA/BEYOND realtime platform: https://ocean.space.noa.gr/seviri/fend_new/index.php .
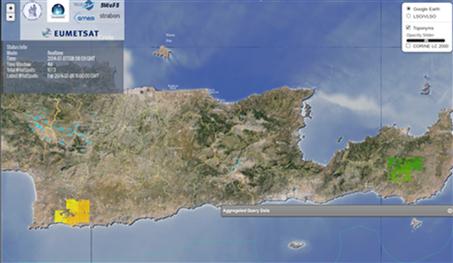
Monitoring the Siteia wildfire (3-4 July 2014, green tales) and Festos wildfire (5 July 2014 – orange tales) from the BEYOND online tool. The red arrow points at Finokalia station.
Smoke dispersion forecasts (NOA)
A prognostic tool for the dispersion of wildfire smoke is also provided online at the BEYOND site. This forecasting tool is built on a synergy betweenMSG/SEVIRI fire hot spot identification and WRF/FLEXPART smoke dispersion simulations.
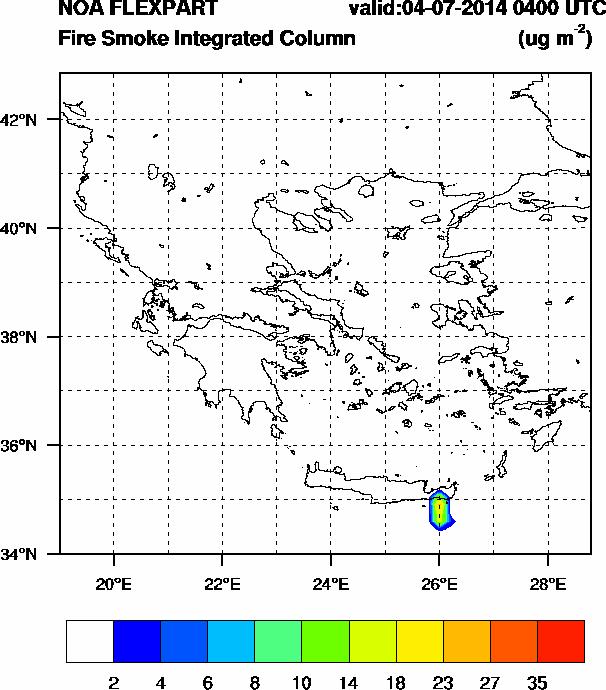
Fire smoke integrated column (μg m-2) during a fire event at Siteia on 4 July 2014. Prevailing north winds resulted in smoke being blown southwards.
Prognostic back-trajectories (NOA)
Forecasting back-trajectories are producedat 12 hour intervals for the measuring stations. The trajectories are routinely computed from the FLEXPART Lagrangian dispersion model driven by WRF forecasts. This informationprovides a first hint to the operating scientists about the origin of the air masses that are expected to arrive at various heights over the site. Finokalia station is located at a cross-road of air mass paths, resulting in complex air quality mixtures that include sea-salt, desert dust, biomass smoke particles and anthropogenic pollutants.
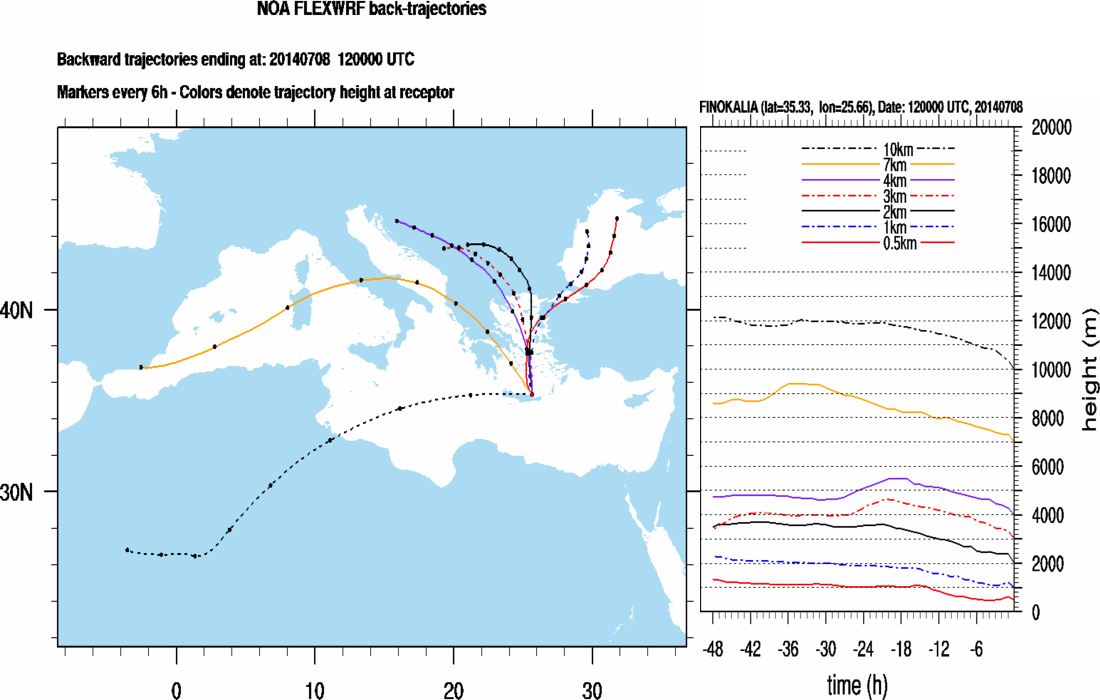
FLEXPART back- trajectories for seven atmospheric layers at the Finokalia station on 8 July 2014, 12:00 UTC.
Meteorological and dust forecasts (BSC, NOA)
Early warning for the arrival of desert dust particles at various atmospheric heights is essential for designing the measurement strategy. These dataare provided by the NMMB dust model from BEYOND twining partners at the Barcelona Supercomputing Center. Additionally, daily WRF meteorological forecasts are provided on site, including station meteograms and wind charts at various heights. This information is of particular interest for the planning of UAV operations.
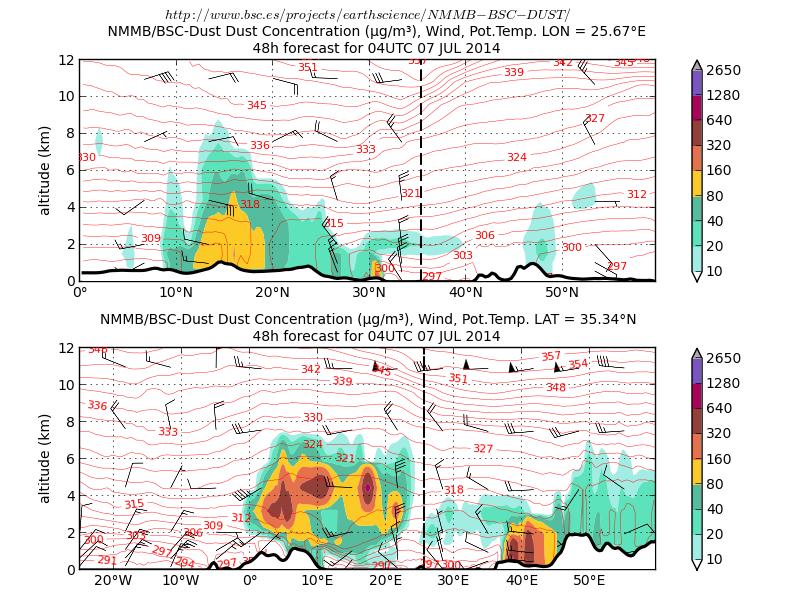
Dust concentration (colour-shaded contours in μg m-3), potential temperature (line contours) and wind barbs along Finokalia measuring site. Upper plot : South-north vertical cross section. Lower plot: West-east vertical cross section.
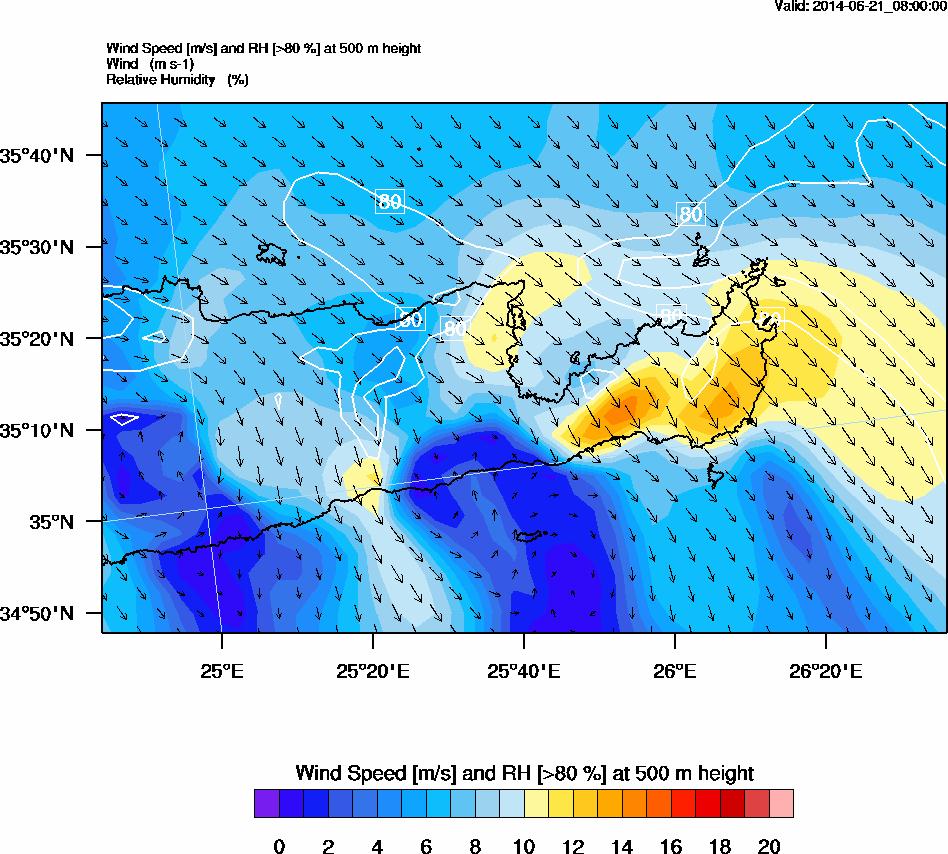
Wind speed (m s-1) and relative humidity contours (%) at 500 m height over the measuring area. RH>80% is an indication for cloud appearance at this height.
Realtime dust AODs from MSG-SEVIRI (UKMO)
Realtime satellite information for dust AOD is provided by the BEYOND twining partners at U.K. Met Office. Satellite data are gridded on a 0.18°×0.18° grid over land and is an indicator of dust in the atmosphere. Satellite AOD images together with dust forecasts and FLEXPART back-trajectories are used by the experimental scientists for the dissemination and interpretation of their measurements.
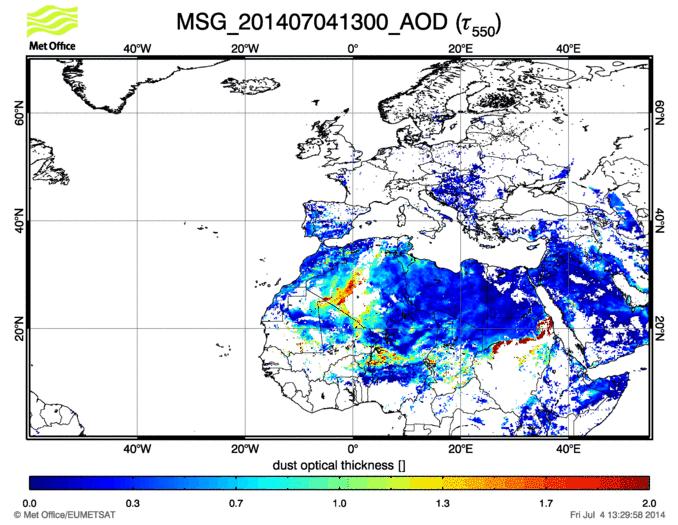
Satellite retrieval of dust optical depth at 550 nm (MSG/SEVIRI). AOD values above 1 are usually associated with dust production over desert sources (see for example the dust hot spots over Algerian desert and along the Sahel zone).
First test of PollyXT lidar instrument (TROPOS)
APollyXT advanced lidar system is developed in the framework of BEYOND in collaboration with TROPOS. A predecessor of the specific lidar was transported to Crete where it is used for the first time in the frame of CHARADMexp.
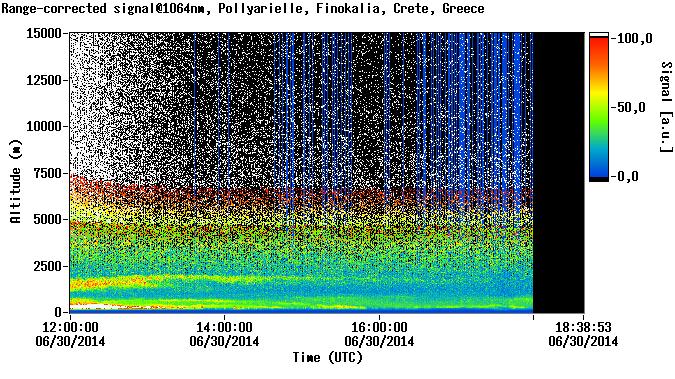
Range-corrected signal @1064 nm.
Discussion: no comments