


From Bob Brewin (Plymouth Marine Laboratory, UK), 31 October – currently doing experiments for ESA aboard the RRS James Clark Ross on the 23rd Atlantic Meridional Transect
Since passing the equator and surviving the ‘crossing the line ceremony’ we have been sampling constantly for over a week. I have now filtered nearly 1500 litres of water through 25mm 0.7 micron filter-pads!
We have now crossed the South Atlantic Gyre one of the least productive regions of the ocean, it’s often referred to as an ‘oceanic desert’. Here, as the photo below shows the water is as blue as it can get.
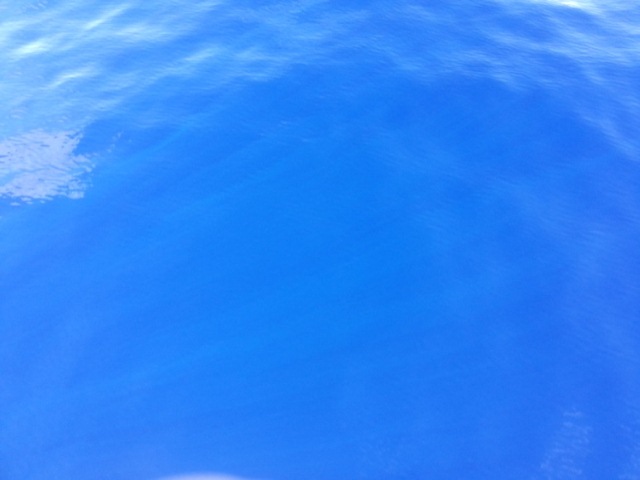
The incredible blue waters of the South Atlantic Gyre. (B. Brewin)
The plot below shows the AMT23 transect overlaid onto a satellite chlorophyll climatology of October. The pink dot (roughly –20 latitude and –25 longitude) highlights where this photo was taken.
It is in a region of the Atlantic Ocean with the lowest total surface chlorophyll concentration –chlorophyll being a photosynthetic pigment in phytoplankton, indicative of its biomass.
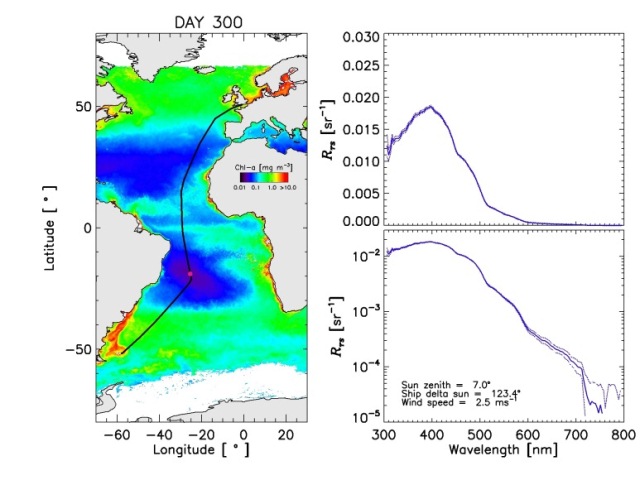
The AMT23 transect overlaid onto a satellite chlorophyll climatology of October. The pink dot shows our current location. It is region of low surface chlorophyll concentration. The graph on the right shows remote-sensing reflectance spectra in the same region. (B. Brewin)
Alongside the map shows a remote-sensing reflectance spectra (after an initial processing) captured using our hypersepctral radiometer (Satlantic HyperSAS) at the same location as the photo was taken.
The remote-sensing reflectance is essentially a ratio of upwelling radiance to downwelling irradiance. In simple terms it is the ratio of light coming out of the ocean to that of light coming into the ocean plotted on a linear and a logarithmic scale (y-axis) as a function of wavelength (x-axis) in the UV to visible portion of the electromagnetic spectrum.
As can be seen in the plot, at UV and blue wavelengths (300–500 nm) the reflectance is very high, whereas green and red wavelengths (500–700nm) the reflectance is much lower.
Part of the reason these waters are so blue is that the phytoplankton concentrations at the surface are very low (the chlorophyll pigment in phytoplankton absorbs blue light), such that the optical properties of pure seawater dominate the reflectance signal (pure seawater absorbs light at red and green wavelengths with a higher intensity than at blue wavelengths, and also scatters blue wavelengths with a higher intensity than red and green wavelengths).
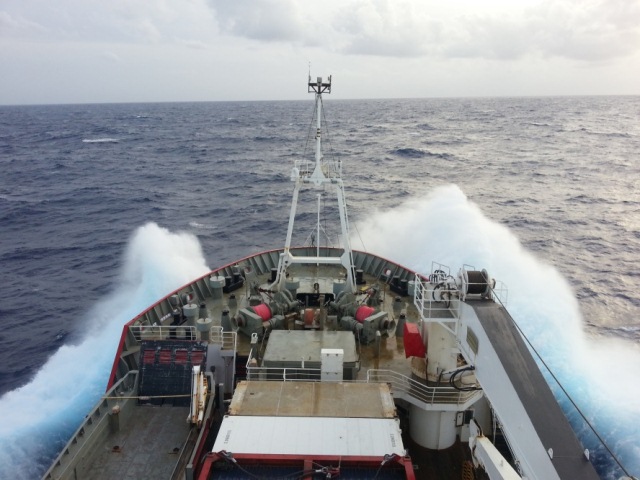
Heading for the Falklands and the sea is getting rougher. (B. Brewin)
We are now heading for the Falklands where we are due to arrive in a week and a half. The sea is already getting rough. However, we are heading for greener waters which essentially means two very importance things: i) we are likely to see more marine life such as whales etc … and ii) I will be filtering less water!
Discussion: no comments